Can Democrats Knock Out Kasich in Ohio?
The 40 percent rate at which Ohio Democrats have won the governorship with a Democrat in the White House over the last century is good for third best in the Midwest – but it hasn’t happened since 1952

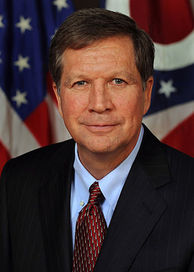
One-term Republican incumbent John Kasich – like fellow GOP Governor Scott Walker in Wisconsin – is a rumored 2016 presidential candidate who presides over a quintessential battleground state.
To be sure, 2014 is not exactly lining up for a Democratic rebound from the 2010 midterms with Barack Obama’s job approval rating languishing in the low 40s.
Still, Ohio Democrats are optimistic that they have put forth a bona fide challenger against Kasich in Cuyahoga County Executive Ed FitzGerald.
That said, just one public poll of the FitzGerald-Kasich matchup (partisan-backed or otherwise) has been released so far this year (by Quinnipiac in mid-February, with Kasich up 43 to 38 among registered voters).
But if Obama continues to record lackluster approval numbers, what kind of chance does FitzGerald have to overcome potential Democratic malaise and upset Kasich this November?
Unlike most Midwestern states, Ohioans have elected a fair number of Democratic governors over the decades when a Democrat sat in the White House.
Ohio Democrats have won eight of 20 such contests since 1900, or 40 percent of the time – not great numbers, but good for third best in the 12-state Midwest region.
Only Missouri (76.9 percent, 10 of 13 races) and Indiana (46.2 percent, 6 of 13) have fared better for Democrats when one of their own is serving as President over the last 110+ years.
The average victory rate for Democratic gubernatorial nominees in the remaining nine states (Illinois, Iowa, Kansas, Michigan, Minnesota, Nebraska, North Dakota, South Dakota, and Wisconsin) is abysmally low at just 21.6 percent.
However, the last time Ohio Democrats kept or got back the keys to the gubernatorial mansion with a Democrat in the White House was 62 years ago in 1952.
Over the last century, Ohio Democratic gubernatorial nominees have been victorious with Woodrow Wilson (1916, 1918), Franklin Roosevelt (1934, 1936, 1944), and Harry Truman (1948, 1950, 1952) at the helm in Washington:
· 1916: Former governor and future Democratic presidential nominee James Cox won the seat with 48.4 percent of the vote, knocking Frank Willis out of office. Willis had done the same to Cox in 1914.
· 1918: Cox was reelected with 50.6 percent in a third consecutive battle against Willis.
· 1934: Former Congressman Martin Davey edged out former Ohio Secretary of State Clarence Brown with 51.1 percent of the vote.
· 1936: Davey won reelection with 52.0 percent over future Republican governor John Bricker.
· 1944: Cleveland Mayor Frank Lausche won his first of five nonconsecutive terms with 51.8 percent against Cincinnati Mayor James Stewart in the open seat race.
· 1948: Lausche defeated Republican incumbent Thomas Herbert (who upset Lausche in 1946) with 53.7 percent of the vote.
· 1950: Lausche won his third term over Treasurer Don Ebright with 52.6 percent.
· 1952: Lausche had his strongest ever performance winning his fourth term with 55.9 percent over future Cincinnati Mayor Charles Taft II.
Since 1952, Democrats have lost the Ohio governorship six contests in a row with John Kennedy (1962), Lyndon Johnson (1966), Jimmy Carter (1978), Bill Clinton (1994, 1998), and Barack Obama (2010) in office.
Meanwhile, Democratic gubernatorial nominees have fared much better when a Republican serves in the White House, winning 15 of 22 contests since 1900, or 68.2 percent of the time.
That is the best mark in the Midwest, with Missouri next at 56.3 percent and Kansas at 44.0 percent.
Ohio Democratic candidates for governor were victorious in 1905 (John Pattison), 1908 (Judson Harmon), 1910 (Harmon), 1912 (James Cox), 1922 (Vic Donahey), 1924 (Donahey), 1926 (Donahey), 1930 (George White), 1932 (White), 1954 (Frank Lausche), 1958 (Michael DiSalle), 1970 (John Gilligan), 1982 (Richard Celeste), 1986 (Celeste), and 2006 (Ted Strickland).
Ohio thus has a +28.2-point differential when Democratic gubernatorial nominees run against the backdrop of a Republican presidency (68.2 percent) versus a Democratic one (40.0 percent).
That is the second largest differential in the region, behind only Wisconsin’s +29.0 points (4.3 percent with a Democratic president and 33.3 percent with a GOPer).
Since 1900, Ohio Democratic candidates for governor have averaged 50.2 percent of the vote when a Republican president was in office and 46.5 percent with a Democratic president.
The odds of Democrats winning back the governorship in 2014 were dealt a minor hit earlier this year when a ruling came down against would-be Libertarian nominee Charlie Earl.
Earl, a former GOP State Representative in the early 1980s, was taken off the ballot by Republican Secretary of State Jon Husted because the Libertarian Party did not disclose that signatures were being gathered by paid professionals (rather than by candidate or party volunteers).
Earl has appealed the ruling to federal court.
Lesser-known Libertarian nominee Ken Matesz won 2.4 percent of the vote in 2010.
Follow Smart Politics on Twitter.
