
Democrats Enduring Nightmarish Presidential Election Slide in 4 States
For the first time in party history, Democrats have lost multiple states by increasingly larger margins in five consecutive presidential elections
 It is hardly a secret that Democrats have struggled mightily in many parts of the South and Appalachia in recent election cycles.
Over the last few decades, legislatures in these states have continued to flip to Republican control with Democratic statewide elected officials becoming a rare breed.
Changing demographics enabled Democrats to somewhat stem the tide in presidential elections this cycle with the party coming closer to victory than at any point over the last two decades in a few states.
For example, Hillary Clinton’s 9.1-point loss in Texas was the best showing by a Democrat since Bill Clinton’s 4.9-point defeat to Bob Dole in 1996.
Likewise, Clinton’s 5.1-point loss in Georgia was the closest Democrats have come to winning the Peach State since her husband’s 1.2-point defeat there in 1996.
Overall, however, Democrats fared rather poorly in the South and are facing absolutely brutal top of the ticket trend lines in multiple states.
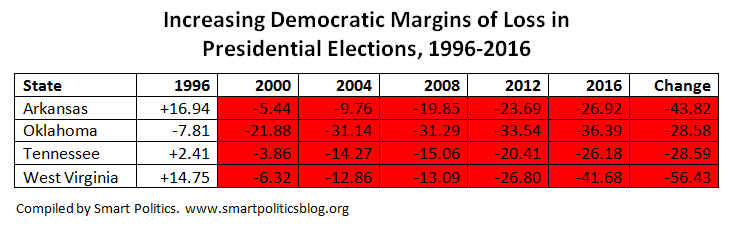
A Smart Politics study finds that for the first time in party history, Democratic presidential nominees have suffered statewide defeats in five consecutive elections by increasingly larger margins – in Arkansas, Oklahoma, Tennessee, and West Virginia.
Prior to 2016, Democrats had never lost a state in five straight elections by bigger margins each cycle.
Democrats had previously lost four elections in a row by larger margins a handful of times such as in Illinois (1860-1872), Maine (1944-1956), and Vermont (1944-1956).
Following a disastrous performance by Hillary Clinton throughout much of the South in 2016, it has now happened to the party in five straight cycles – and in four states.
In Arkansas, Al Gore followed Bill Clinton’s easy 16.9-point home state victory in 1996 with a 5.4-point loss in 2000.
John Kerry then lost the state by 9.8 points in 2004, with Obama losing by 19.9 points in 2008 and 23.7 points in 2012.
In 2016, Clinton was blown out by 26.9 points in Arkansas – the second biggest defeat ever for the party in the Natural State behind George McGovern’s 38.1-point loss to Richard Nixon in 1972.
In Oklahoma, where Democrats have lost 13 consecutive elections since 1968, Gore lost by 21.9 points in 2000 – 14.1 points more than Clinton in 1996 (7.8 points). Kerry lost the state by 31.1 points with Obama falling by 31.3 points in 2008 and 33.5 points in 2012.
Trump then demolished Clinton by 36.4 points in the Sooner State – the third worst showing by a Democratic presidential nominee in Oklahoma history behind McGovern (49.7 points) and Walter Mondale in 1984 (37.9 points).
In Tennessee, the party was embarrassed in 2000 when Vice President Gore famously lost his home state by 3.9 points after Bill Clinton had carried it in 1992 and 1996.
Democratic nominees have suffered double-digit losses in the Volunteer State ever since: Kerry by 14.3 points, Obama by 15.1 points and 20.4 points, and Clinton by 26.2 points.
Clinton’s defeat was the third largest in party history behind McGovern (37.9 points) and Horatio Seymour in 1868 (36.9 points to Ulysses Grant).
In West Virginia, Democrats followed up victories in 1988, 1992, and 1996 with losses by 6.3 points in 2000, 12.9 points in 2004, 13.1 points in 2008, 26.8 points in 2012, and an astounding 41.7 points in 2016.
Clinton’s huge loss in the Mountain State broke a 152-year party record – eclipsing George McClellan’s 36.5-point loss to Abraham Lincoln in 1864 a year after statehood.
Overall, the margin between Republican and Democratic nominees from 1996 to 2016 moved 56.4 points in the GOP’s favor in West Virginia, 43.8 points in Arkansas, and 28.6 points in both Oklahoma and Tennessee.
The all-time record for consecutive cycles in which the Democratic nominee’s margin of loss increased or margin of victory decreased is 10 – set in Georgia from 1936 to 1972.
After Franklin Roosevelt won the Peach State by 83.8 points in 1932, Democratic nominees won Georgia by narrower margins for the next seven cycles through 1960 and then lost the state by increasingly larger margins for the next three cycles through 1972.
Follow Smart Politics on Twitter.
1. TN: (…”embarrassed…”) Had just 2% of W’s voters chosen the then-Reform Party, a write-in (if permitted at the time), or simply abstained (supposedly about 81,000 loyal MI Ds did just that with the top of the ticket this past cycle), the Iraq War of 2003 surely would not have taken place. Also, kudos for not stating that Gore is a “native” of the Volunteer State the way all too many media organisations do.
2. Appalachia, Dixie, “Flyover Country”: Had “thedonald” come out on the short end of the Electoral College tally -the only metric that matters, his recent hysterical rants and ravings regarding his national popular vote deficit notwithstanding- this and many other sites and forums would be going on and on and on about the “nightmarish slides” and other doomsday trajectories The Formerly The Party of Lincoln is encountering in numerously or densely populated, traditionally R venues, such as Fort Bend County, TX, Orange County, CA, and the strip of real estate from VA to the south of Maine (CD-01).
Does the diminishing support for Democrats extend even to states that voted for Democrat candidates ?
For example, look at Minnesota and the trend
(BTW … if Evan McMullin wasn’t on the Minnesota ballot [in some states he had to be a write-in so being on the ballot made it easier for him to get 53,076 votes], it is arguable that Trump could have won Minnesota)
2016 Hillary Clinton and Tim Kaine 1,367,716 46.44%
2012 BARACK OBAMA AND JOE BIDEN 1,546,167 52.65%
2008 BARACK OBAMA AND JOE BIDEN 1,573,354 54.06%
2004 JOHN F. KERRY AND JOHN EDWARDS 1,445,014 51.09%
2000 AL GORE AND JOE LIEBERMAN 1,168,266 47.91%
2016 Donald J. Trump and Michael R. Pence 1,322,951 44.92%
2012 MITT ROMNEY AND PAUL RYAN 1,320,225 44.96%
2008 JOHN MCCAIN AND SARAH PALIN 1,275,409 43.82%
2004 GEORGE W. BUSH AND DICK CHENEY 1,346,695 47.61%
2000 GEORGE W. BUSH AND DICK CHENEY 1,109,659 45.5%
Combine that with the transfer of legislature power in Minnesota, it is hard to say that the “purple” state is trending red.