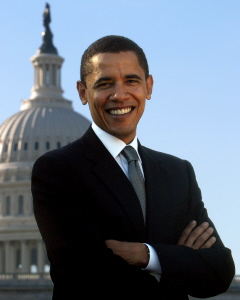
What Will Be the ‘Obama Effect’ on the 2010 Minnesota Gubernatorial Race?

While Minnesota is considered a Democratic-trending battleground state, the DFL has not won the Governor’s office in nearly a quarter-century.
Additionally, a new Smart Politics historical analysis of the impact of the sitting president’s political party on Minnesota gubernatorial races suggests having a Democrat in the White House might spell bad news for the DFL in 2010.
A Smart Politics analysis of Minnesota’s 28 gubernatorial elections since 1930 finds a DFLer or a Democrat has been elected to the Governor’s mansion with a Democratic president in D.C. on only 1 occasion.
Overall, since 1930, Minnesota has elected 15 Republicans, 8 DFLers, 4 Farmer-Laborites, and 1 Reform Party candidate as Governor of the Gopher State. But only once, in 1962, has a DFLer won a gubernatorial race (Karl Rolvaag) with a Democrat in the White House (John F. Kennedy).
Until quite recently Minnesota Republicans also struggled in gubernatorial contests when a member of their party controlled the White House. Republican presidents have been in office 13 times since 1930 with gubernatorial contests on Minnesota’s Election Day ballot. Republicans have won the governorship just 4 times, although three of these have occurred since 1990: Elmer Anderson in 1960 (Eisenhower), Arne Carlson in 1990 (Bush 41), and Tim Pawlenty in 2002 and 2006 (Bush 43).
In total, the President’s political party has carried the day in Minnesota gubernatorial elections in just 5 of 28 races since 1930, or 18 percent of the time. Even more startling, the president’s party has lost by an average margin of 21.2 points during these 23 races.
As for Obama, his approval rating in Minnesota was at a yearly low of 59 percent in a mid-June SurveyUSA poll, until a recently released survey by Public Policy Polling found that rating slip to 54 percent in early July.
To what extent does the popularity or unpopularity of the President come into play in this historical trend? The data suggests there is some influence on Minnesota gubernatorial elections.
For example, Gallup public opinion data since 1942 shows that the average presidential approval rating closest to Election Day to be 49.6 percent for those 18 years in which the President’s party did not win the governor’s race in Minnesota.
During the 5 elections outlined above in which the President’s party did win the gubernatorial contest in the Gopher State, the average approval rating was higher, at 55.8 percent. (That total includes George W. Bush’s 38 percent approval rating endured by Governor Pawlenty during his remarkable 2006 victory that brought him into the national spotlight).
Still, high approval ratings do not provide fool-proof coattails: the top 4 presidential approval ratings heading into November elections all failed to carry the Gopher State governor’s race for the president’s party: FDR in 1942 (70 percent) and 1944 (70 percent), Eisenhower in 1956 (67 percent), and Clinton in 1998 (66 percent).
Minnesota Gubernatorial Party Victor vis-à-vis Partisan Control of the White House, 1930-2006
|
Year
|
President
|
Party
|
Pres. Approval
|
Gov. Winner
|
Pres. Party MoV
|
|
2006
|
Bush
|
GOP
|
38
|
GOP
|
1.0
|
|
2002
|
Bush
|
GOP
|
63
|
GOP
|
7.9
|
|
1998
|
Clinton
|
Democrat
|
66
|
Reform
|
-8.9
|
|
1994
|
Clinton
|
Democrat
|
46
|
GOP
|
-29.2
|
|
1990
|
Bush
|
GOP
|
58
|
GOP
|
3.3
|
|
1986
|
Reagan
|
GOP
|
63
|
DFL
|
-13.0
|
|
1982
|
Reagan
|
GOP
|
43
|
DFL
|
-18.9
|
|
1978
|
Carter
|
Democrat
|
49
|
GOP
|
-7.0
|
|
1974
|
Ford
|
GOP
|
54
|
DFL
|
-33.4
|
|
1970
|
Nixon
|
GOP
|
58
|
DFL
|
-8.5
|
|
1966
|
LBJ
|
Democrat
|
44
|
GOP
|
-5.7
|
|
1962
|
JFK
|
Democrat
|
62
|
DFL
|
0.0
|
|
1960
|
Eisenhower
|
GOP
|
58
|
GOP
|
1.5
|
|
1958
|
Eisenhower
|
GOP
|
57
|
DFL
|
-14.5
|
|
1956
|
Eisenhower
|
GOP
|
67
|
DFL
|
-3.2
|
|
1954
|
Eisenhower
|
GOP
|
61
|
DFL
|
-5.9
|
|
1952
|
Truman
|
Democrat
|
32
|
GOP
|
-11.3
|
|
1950
|
Truman
|
Democrat
|
41
|
GOP
|
-22.4
|
|
1948
|
Truman
|
Democrat
|
39
|
GOP
|
-8.0
|
|
1946
|
Truman
|
Democrat
|
33
|
GOP
|
-19.3
|
|
1944
|
FDR
|
Democrat
|
70
|
GOP
|
-23.8
|
|
1942
|
FDR
|
Democrat
|
70
|
GOP
|
-42.1
|
|
1940
|
FDR
|
Democrat
|
N/A
|
GOP
|
-41.0
|
|
1938
|
FDR
|
Democrat
|
N/A
|
GOP
|
-54.1
|
|
1936*
|
FDR
|
Democrat
|
N/A
|
F-L
|
-60.7
|
|
1934
|
FDR
|
Democrat
|
N/A
|
F-L
|
-27.8
|
|
1932
|
Hoover
|
GOP
|
N/A
|
F-L
|
-34.2
|
|
1930
|
Hoover
|
GOP
|
N/A
|
F-L
|
-23.0
|
* The Democrats did not field a candidate in the 1936 gubernatorial election. Approval rating data based on the latest Gallup (for 1944, OPOR) polling data available before the gubernatorial election day. Data compiled by Smart Politics.
Follow Smart Politics on Twitter.
