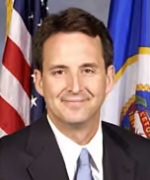
How Does Tim Pawlenty Rank in the Gubernatorial Class of 2002 on Jobs?
Minnesota Governor has presided over 64.4 percent increase in unemployment, slightly better than his gubernatorial Class of ’02 as well as the national average

Some may judge the Governor on his efforts to fight increases in state taxes. Others may look at how those efforts may have contributed to the state’s looming (and ballooning) budget deficit.
One non-partisan measure by which the Governor’s performance might be judged is to examine the jobs situation in Minnesota, relative to the rest of the country, during his eight years in office.
Pawlenty was elected along with 23 other new governors in November of 2002, 16 of which remain in office today. By January 2011, all remaining 17 governors will be out of office, either retiring like Pawlenty or term-limited.
When Pawlenty took office in January 2003, the seasonally adjusted unemployment rate in Minnesota was 4.5 percent. With seven months left in his administration, the most recent unemployment rate in the Gopher State is 7.4 percent, or an increase of 64.4 percent. (April’s jobless numbers will be released later this week).
The 64.4 percent increase in unemployment experienced in Minnesota during Pawlenty’s tenure is slightly less than the national average. In January 2003, the national jobless rate was 5.8 percent – rising to 9.7 percent in March, or an increase of 67.2 percent.
(The national jobless rate increased to 9.9 percent in April).
As for the Class of 2002, Pawlenty’s ranks 8th out of the 17 governors still in office in terms of minimizing the rate of increase in unemployment for each governor’s respective state.

And while Oregon’s unemployment rate is still in double digits – at 10.6 percent – it has only increased 35.9 percent since Democratic Governor Ted Kulongoski took office nearly eight years ago (7.8 percent) – making Kulongoski in line to be the Class Salutatorian on the jobs issue by this measure.
Pawlenty ranks third among the eight Republican governors remaining from the Class of 2002, behind Vermont’s Jim Douglas and South Dakota’s Mike Rounds.
Vermont has seen its unemployment rate rise 44.4 percent to date during Douglas’ four two-year terms (from 4.5 to 6.5 percent), while South Dakota’s jobless rate has increased 45.5 percent (from 3.3 to 4.8 percent).
Overall, the eight Republican governors remaining from the Class of 2002 have presided over an average 87.1 percent increase in unemployment from 4.7 to 9.0 percent across Alabama, Georgia, Hawaii, Minnesota, Rhode Island, South Carolina, South Dakota, and Vermont.
The nine Democratic governors remaining from the Class of 2002 have presided over an average increase in unemployment of 63.9 percent, from 5.7 to 9.3 percent across Maine, Michigan, New Mexico, Oklahoma, Oregon, Pennsylvania, Tennessee, Wisconsin, and Wyoming.
Increase in Unemployment in States with Governors from the Class of 2002, January 2003-March 2010
|
Rank
|
State
|
Governor
|
Party
|
Jan 03
|
Mar 10
|
Change
|
|
1
|
OK
|
Brad Henry
|
Dem
|
5.4
|
6.6
|
+22.2
|
|
2
|
OR
|
Ted Kulongoski
|
Dem
|
7.8
|
10.6
|
+35.9
|
|
3
|
VT
|
Jim Douglas
|
GOP
|
4.5
|
6.5
|
+44.4
|
|
4
|
SD
|
Mike Rounds
|
GOP
|
3.3
|
4.8
|
+45.5
|
|
5
|
NM
|
Bill Richardson
|
Dem
|
5.8
|
8.8
|
+51.7
|
|
6
|
PA
|
Ed Rendell
|
Dem
|
5.8
|
9.0
|
+55.2
|
|
7
|
WI
|
Jim Doyle
|
Dem
|
5.5
|
8.8
|
+60.0
|
|
8
|
MN
|
Tim Pawlenty
|
GOP
|
4.5
|
7.4
|
+64.4
|
|
9
|
WY
|
Dave Freudenthal
|
Dem
|
4.4
|
7.3
|
+65.9
|
|
10
|
ME
|
John Baldacci
|
Dem
|
4.8
|
8.2
|
+70.8
|
|
11
|
HI
|
Linda Lingle
|
GOP
|
3.7
|
6.9
|
+86.5
|
|
12
|
SC
|
Mark Sanford
|
GOP
|
6.4
|
12.2
|
+90.6
|
|
13
|
TN
|
Phil Bredesen
|
Dem
|
5.3
|
10.6
|
+100.0
|
|
14
|
AL
|
Bob Riley
|
GOP
|
5.2
|
11.0
|
+111.5
|
|
15
|
MI
|
Jennifer Granholm
|
Dem
|
6.6
|
14.1
|
+113.6
|
|
16
|
GA
|
Sonny Perdue
|
GOP
|
4.9
|
10.6
|
+116.3
|
|
17
|
RI
|
Donald Carcieri
|
GOP
|
5.3
|
12.6
|
+137.7
|
|
|
Average
|
|
|
5.2
|
9.2
|
+74.9
|
|
|
National
|
|
|
5.8
|
9.7
|
+67.2
|
Bureau of Labor Statistics data compiled by Smart Politics.
Follow Smart Politics on Twitter.
