Gubernatorial Horserace Polling Down Slightly from 2006, Rasmussen Dominates the Field
Polling up substantially in New York and Nevada but down big in Michigan, Pennsylvania, and Maryland; Rasmussen surveys now account for over 50 percent of the horserace polling universe

While many journalists, political scientists, and even candidates have lamented for years on how horserace polling frames media coverage of political campaigns, polls still seem to dominate the journalistic landscape, perhaps more so than ever before.
But is there more polling?
A Smart Politics analysis of gubernatorial polling in the 2006 and 2010 election cycles finds polling has actually declined slightly overall, but has increased by nearly a third by one organization, Rassmussen Reports, which now accounts for over half of horserace polling.
Smart Politics examined horserace polling for the 36 states with governor’s races on the ballot in the 2006 and 2010 election cycles, with survey end dates up to September 30th of each respective year. (The 2010 special gubernatorial election in Utah was not included).
Only polls conducted or sponsored by news organizations, academic institutions, or independent / non-partisan pollsters were considered.
Excluded from analysis were internal polls from candidates, polls from survey organizations that have a long history with partisan ties (e.g. Democracy Corps, Public Policy Polling, Public Opinion Strategies), or polling conducted for partisan media outlets (e.g. Daily Kos).
Also excluded were polls conducted via the Internet (e.g. Zogby/WSJ in 2006) or polls that only offered respondents generic candidate choices.
Despite a significantly different political landscape in 2010 compared to four years ago, the amount of polling of gubernatorial elections in the aggregate is remarkably consistent.
There has even been a small dip in polling, despite a seemingly growing appetite for its findings in the media.
Smart Politics finds there have been 528 gubernatorial horserace polls conducted through the first 23 months of the 2010 election cycle (post-election November 2008 through September 2010), down 2.2 percent from the same 23-month period for 2006 (540 polls).
In a few respects, the dynamics of the 2006 and 2010 election cycles are polar opposites.
In terms of partisan momentum, 2006 was a Democratic election year, while 2010 finds the Republican Party poised to make waves in state and federal elections.
In the 2006 gubernatorial elections, 27 incumbents were on the ballot, with just nine open races. In 2010, due to a large pool of term-limited governors, just 12 incumbents are on the general election ballot, with 24 open races.
But there are also significant differences between 2006 and 2010 regarding who is doing the polling and what states are being surveyed.
In 2006, the Pennsylvania gubernatorial race was the most polled in the nation through September of that year, with 49 surveys conducted during Democrat Ed Rendell’s bid for a second term.
Close behind were Michigan (46 polls), Ohio (36), California (35), Massachusetts (35), Florida (34), and Maryland (30).
Top 10 Most Polled 2006 Gubernatorial Contests through September 30th
|
Rank
|
State
|
Status
|
# Polls
|
|
1
|
Pennsylvania
|
Incumbent
|
49
|
|
2
|
Michigan
|
Incumbent
|
46
|
|
3
|
Ohio
|
Open
|
36
|
|
4
|
California
|
Incumbent
|
35
|
|
4
|
Massachusetts
|
Open
|
35
|
|
6
|
Florida
|
Open
|
34
|
|
7
|
Maryland
|
Incumbent
|
30
|
|
8
|
New York
|
Open
|
26
|
|
9
|
Texas
|
Incumbent
|
21
|
|
10
|
Illinois
|
Incumbent
|
16
|
Data compiled by Smart Politics.
The 265 polls conducted across the top seven states listed above in 2006 accounted for 49.1 percent of all gubernatorial polling for the 36 states holding elections that cycle.
But in 2010, these seven states account for just 36.4 percent (192 surveys) of all gubernatorial horserace polling.
New York’s gubernatorial race has set the pace in 2010, with 45 public polls, followed by Florida (42), Ohio (39), California (36), Pennsylvania (29), and Nevada (29).
Top 10 Most Polled 2010 Gubernatorial Contests through September 30th
|
Rank
|
State
|
Status
|
# Polls
|
|
1
|
New York
|
Open
|
45
|
|
2
|
Florida
|
Open
|
42
|
|
3
|
Ohio
|
Incumbent
|
39
|
|
4
|
California
|
Open
|
36
|
|
5
|
Pennsylvania
|
Open
|
29
|
|
5
|
Nevada
|
Open*
|
29
|
|
7
|
Massachusetts
|
Incumbent
|
22
|
|
8
|
Colorado
|
Open
|
20
|
|
9
|
Texas
|
Incumbent
|
19
|
|
10
|
Wisconsin
|
Open
|
17
|
* Nevada Governor Jim Gibbons defeated in the GOP primary. Data compiled by Smart Politics.
The increased focus among pollsters on the open New York race in 2010 was the largest over the two cycles, with 19 more polls conducted this year compared to this stage of the election cycle in 2006.
This shift is curious, as polls have consistently shown New York’s gubernatorial race to be one of the least competitive in the nation – both before and after it became known whether Democrat Andrew Cuomo’s GOP opponent would be Rick Lazio or Carl Paladino.

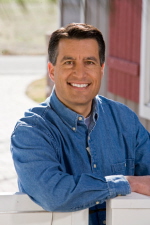
The (fairly uncompetitive) gubernatorial race between Republican Brian Sandoval (pictured) and Democrat Rory Reid to some extent got caught in the pollsters’ crossfire, although scandal-plagued Republican Governor Jim Gibbons getting defeated in the GOP primary by Sandoval did create some additional interest in the race.
Florida (+8 polls) and Colorado (+7) also have seen a bump in pollster interest – the latter due in part to controversies among the 2010 GOP Republican hopefuls and the subsequent entrance into the race of former Republican presidential candidate and Congressman Tom Tancredo on the Constitution Party ticket.
And in which states has pollster interest in gubernatorial elections declined from 2006?
The biggest decrease in polling has been in Michigan’s open governor’s race where Republican Rick Snyder has frequently polled with a 20-point or larger advantage against Democrat Virg Bernero.
During Jennifer Granholm’s 2006 reelection bid, 46 polls were conducted in Michigan through September of that year, compared to just 11 in 2010.
However, the uncompetitive nature of the Michigan governor’s race is likely only part of the story.
In 2010, polling sponsored by news organizations in The Wolverine State has declined substantially. In 2006, the Detroit News (20) and Detroit Free Press (4) conducted two-dozen polls at this stage of the campaign. That number has dropped to just two polls during the 2010 cycle.
A similar story has unfolded in Maryland and Massachusetts – states with the third and fourth largest drops in gubernatorial horserace polling, despite both races being quite competitive this year.
In Massachusetts, the number of horserace polls has declined from 35 in 2006 to 22 in 2010. The State House News Service had conducted six polls through September 2006, compared to just one in 2010. News outlets had also sponsored six SurveyUSA polls in 2006, but none in 2010. The number of polls by Suffolk University has also been cut in half, from 10 in 2006 to five in 2010.

Pennsylvania, meanwhile, has seen the second biggest drop in the number of gubernatorial horserace surveys, from 49 in 2006 to just 29 in 2010.
The change in Pennsylvania has been due in large part to a decline in the number of polls sponsored and conducted by academic institutions.
In 2006, Franklin & Morris, Quinnipiac, Mansfield University, and West Chester University had tallied 22 polls at this stage of the campaign, compared to just nine thus far in 2010.
But not all academic pollsters have cut back their polling efforts in 2010.
Quinnipiac’s famed polling organization has delivered as many polls in 2010 across the five states they track (Connecticut, Florida, New York, Pennsylvania, Ohio) as they did in 2006 (40), although it has shifted its focus.
The distribution of Quinnipiac polling has moved somewhat away from Connecticut and Pennsylvania (21 polls in 2006, 14 in 2010) and more into Ohio (2 polls in 2006, 11 in 2010).
But the biggest sea change in 2010 has perhaps not been what races have been surveyed, but what organizations are doing the polling.
Although criticized by many – some from the old school for its use of IVR methodology (interactive voice response), some for its one-day polling sample, and some for its founder’s frequent appearances on the FOX News Channel – Rasmussen gubernatorial horserace polls have both soared in absolute number from 2006 to 2010 as well as the share of total gubernatorial polling conducted during these two cycles.
In 2006, Rasmussen conducted 204 horserace polls across all but a small handful of the 36 states holding gubernatorial elections that November. Rasmussen was the most prolific pollster ‘in the field’ that cycle, accounting for 37.8 percent of the 540 polls taken through September.
In 2010, Rasmussen gubernatorial horserace polling has increased 32.8 percent, with 271 polls conducted through September of this year, tracking all 36 states.
Rasmussen now accounts for more than half of all non-partisan public polling of gubernatorial races, taking ownership of 51.3 percent of the 528 polls completed this cycle.
SurveyUSA, which also uses the IVR polling method – although for news organization sponsors – has seen its share of the gubernatorial polling universe drop from 10.4 percent in the 2006 cycle to just 4.0 percent in 2010 through September.
With its 40 polls conducted through September, Quinnipiac, at 7.6 percent, is now the second most prolific pollster this election cycle in gubernatorial contests.
Another interesting trend when comparing 2006 to 2010 is how prominent national news organizations have taken a particularly strong interest in conducting their own polling of gubernatorial races today compared to four years ago.
In 2006, CNN, Reuters, and FOX only sponsored one such poll cumulatively by September 30th, or just 0.2 percent of all gubernatorial polling. In 2010, these three organizations have conducted or sponsored 36 polls, or 6.9 percent.
But if polling is actually down slightly in 2010, why does it seem like it is on the rise?
While there has not been more non-partisan horserace polling this election cycle compared to 2006, that does not mean there has been less coverage of polling results.
In fact, news organizations just a few years ago used to be gun-shy about reporting non-partisan IVR polls.
Now the media is not only frequently reporting numbers from Rasmussen and SurveyUSA, organization which have a proven track record over the last few election cycles, but also horserace numbers released by partisan polling outfits.
A new poll means new news – no matter who is behind it.

Oberstar’s campaign then made headlines in their own right by attacking the validity of the Public Opinion Strategies survey, calling it a ‘push poll.’
The frequency of polling from all quarters for the remaining few weeks of the 2010 election cycle is sure to intensify, just as it did in 2006.
The continuing challenge for journalists will be to decide how much emphasis to place on these polls, and whether results by some survey organizations should be considered ‘news’ at all.
Change in Frequency of Polling of Gubernatorial Races by State, 2006 vs. 2010
|
State
|
2006
|
2010
|
Change
|
|
New York
|
26
|
45
|
+19
|
|
Nevada
|
13
|
29
|
+16
|
|
Florida
|
34
|
42
|
+8
|
|
Colorado
|
13
|
20
|
+7
|
|
Arizona
|
7
|
13
|
+6
|
|
Georgia
|
7
|
13
|
+6
|
|
South Dakota
|
2
|
8
|
+6
|
|
Idaho
|
1
|
6
|
+5
|
|
Hawaii
|
0
|
5
|
+5
|
|
Oregon
|
8
|
12
|
+4
|
|
New Mexico
|
4
|
8
|
+4
|
|
Ohio
|
36
|
39
|
+3
|
|
New Hampshire
|
9
|
12
|
+3
|
|
Wisconsin
|
15
|
17
|
+2
|
|
Tennessee
|
4
|
6
|
+2
|
|
Wyoming
|
2
|
4
|
+2
|
|
California
|
35
|
36
|
+1
|
|
Minnesota
|
13
|
14
|
+1
|
|
Rhode Island
|
12
|
13
|
+1
|
|
Oklahoma
|
6
|
7
|
+1
|
|
Alaska
|
5
|
6
|
+1
|
|
Iowa
|
13
|
13
|
0
|
|
Illinois
|
16
|
15
|
-1
|
|
Nebraska
|
3
|
2
|
-1
|
|
Texas
|
21
|
19
|
-2
|
|
Connecticut
|
14
|
12
|
-2
|
|
Kansas
|
8
|
6
|
-2
|
|
South Carolina
|
8
|
6
|
-2
|
|
Arkansas
|
13
|
10
|
-3
|
|
Vermont
|
7
|
4
|
-3
|
|
Alabama
|
11
|
5
|
-6
|
|
Maine
|
14
|
6
|
-8
|
|
Massachusetts
|
35
|
22
|
-13
|
|
Maryland
|
30
|
13
|
-17
|
|
Pennsylvania
|
49
|
29
|
-20
|
|
Michigan
|
46
|
11
|
-35
|
|
Total
|
540
|
528
|
-12
|
Through September 30th of each election cycle. Data compiled by Smart Politics.
Follow Smart Politics on Twitter.
