Is Democratic Hold on Wisconsin’s 2012 U.S. Senate Seat Tied to an Obama Victory?
Badger State has voted for same party of U.S. Senate and Presidential nominees in 14 of 16 election cycles over the last century

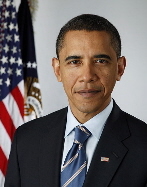
Obama has already visited the Badger State a half-dozen times since his inauguration and will stop in Manitowoc – a city approximately 90 minutes north of Milwaukee on Lake Michigan – in his first post-State of the Union stop later this month.
To be sure, Wisconsin’s 10 electoral votes are a key puzzle piece to the President’s 2012 reelection picture.
But just how nervous should Obama and Wisconsin Democrats be?
On the plus side, Obama’s 56.2 percent of the vote in Wisconsin in 2008 was the second largest tally by a Democratic presidential nominee in the state since 1940 and the 4th best in the history of the Badger State across 41 election cycles.
Only Franklin Roosevelt in 1936 (63.8 percent) and 1932 (63.5 percent) and Lyndon Johnson in 1964 (62.1 percent) fared better than Obama in 2008 among Democratic nominees throughout history.
However, the President’s impressive performance does not guarantee a long half life of subsequent success for the Democratic presidential nominee in Wisconsin – FDR’s support dwindled to 50.1 percent in 1940 and then a loss in 1944, while Johnson’s VP – Hubert Humphrey – failed to carry the state as the nominee in 1968.
Democratic Vote for President in Wisconsin, 1848-2008
|
Rank
|
Year
|
Democrat
|
Percent
|
Result
|
|
1
|
1936
|
Franklin Roosevelt
|
63.8
|
Won
|
|
2
|
1932
|
Franklin Roosevelt
|
63.5
|
Won
|
|
3
|
1964
|
Lyndon Johnson
|
62.1
|
Won
|
|
4
|
2008
|
Barack Obama
|
56.2
|
Won
|
|
5
|
1852
|
Franklin Pierce
|
52.0
|
Won
|
|
6
|
1988
|
Michael Dukakis
|
51.4
|
Won
|
|
7
|
1948
|
Harry Truman
|
50.7
|
Won
|
|
8
|
1940
|
Franklin Roosevelt
|
50.1
|
Won
|
|
9
|
2004
|
John Kerry
|
49.7
|
Won
|
|
10
|
1976
|
Jimmy Carter
|
49.4
|
Won
|
|
11
|
1996
|
Bill Clinton
|
48.8
|
Won
|
|
12
|
1944
|
Franklin Roosevelt
|
48.6
|
Lost
|
|
13
|
1876
|
Samuel Tilden
|
48.4
|
Lost
|
|
14
|
1960
|
John Kennedy
|
48.0
|
Lost
|
|
15
|
2000
|
Al Gore
|
47.8
|
Won
|
|
16
|
1892
|
Grover Cleveland
|
47.7
|
Won
|
|
17
|
1884
|
Grover Cleveland
|
45.8
|
Lost
|
|
18
|
1984
|
Walter Mondale
|
45.0
|
Lost
|
|
18
|
1872
|
Horace Greeley
|
45.0
|
Lost
|
|
20
|
1968
|
Hubert Humphrey
|
44.3
|
Lost
|
|
20
|
1928
|
Alfred Smith
|
44.3
|
Lost
|
|
22
|
1856
|
James Buchanan
|
44.2
|
Lost
|
|
23
|
1864
|
George McClellan
|
44.1
|
Lost
|
|
24
|
1888
|
Grover Cleveland
|
43.8
|
Lost
|
|
24
|
1868
|
Horatio Seymour
|
43.8
|
Lost
|
|
26
|
1972
|
George McGovern
|
43.7
|
Won
|
|
27
|
1980
|
Jimmy Carter
|
43.2
|
Lost
|
|
28
|
1880
|
Winfield Hancock
|
42.9
|
Lost
|
|
29
|
1916
|
Woodrow Wilson
|
42.8
|
Lost
|
|
30
|
1860
|
Stephen Douglas
|
42.7
|
Lost
|
|
31
|
1992
|
Bill Clinton
|
41.2
|
Won
|
|
32
|
1912
|
Woodrow Wilson
|
41.1
|
Won
|
|
33
|
1952
|
Adlai Stevenson
|
38.7
|
Lost
|
|
34
|
1848
|
Lewis Cass
|
38.3
|
Won
|
|
35
|
1956
|
Adlai Stevenson
|
37.8
|
Lost
|
|
36
|
1896
|
William J. Bryan
|
37.0
|
Lost
|
|
37
|
1908
|
William J. Bryan
|
36.7
|
Lost
|
|
38
|
1900
|
William J. Bryan
|
36.0
|
Lost
|
|
39
|
1904
|
Alton Parker
|
28.0
|
Lost
|
|
40
|
1920
|
James Cox
|
16.2
|
Lost
|
|
41
|
1924
|
John Davis
|
8.1
|
Lost
|
Table compiled by Smart Politics.
But Obama’s performance at the top of the ticket in Wisconsin may not simply impact who wins the White House – it could also determine the balance of power in the U.S. Senate.
A Smart Politics review of historical U.S. Senate election results finds that Wisconsin has voted for the same political party in U.S. Senate and presidential elections in 14 of 16 cycles, dating back to the birth of popular vote contests in 1914.
Wisconsinites have currently cast their ballots for the same political party in U.S. Senate and presidential contests in six consecutive elections: in 1976 (Democrat), 1980 (Republican), 1988 (Democrat), 1992 (Democrat), 2000 (Democrat), and 2004 (Democrat).
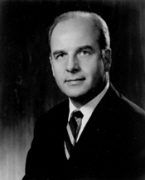
The last time the state split its statewide federal office ticket was in 1968, when Richard Nixon carried Wisconsin while Democrat Gaylord Nelson defeated GOPer Jerris Leonard by 23.4 points.
The only other time the Badger State failed to rally behind the same party in both presidential and senatorial races was in 1940, when Roosevelt carried Wisconsin and Progressive Senator Robert La Follette, Jr. was sent back to D.C. for a fourth term.
In each of the eight remaining election cycles, the same party carried both the vote for president and U.S. Senator in Wisconsin: in 1916 (Republican), 1920 (Republican), 1928 (Republican), 1932 (Democrat), 1944 (Republican), 1952 (Republican), 1956 (Republican), and 1964 (Democrat).
The tenuousness of the Democrat’s hold on their lone Senate seat also hinges in part on whether four-term Senator Herb Kohl opts to retire (Kohl is ranked near the top on many retirement “watch lists”).

Nelson was defeated by 1.9 points in 1980 (by Kasten) when Ronald Reagan carried Wisconsin by 4.7 points over Jimmy Carter.
Kasten, meanwhile, lost his Senate seat to Russ Feingold by 6.6 points in 1992 when Bill Clinton defeated George Bush by 4.4 points.
In short, a Kohl reelection bid does not guarantee a Democratic victory despite the favorable odds D.C. prognosticators have awarded him early in the cycle.
Overall, Democratic presidential nominees have won Wisconsin 17 times since statehood in 1848 with Republicans winning 23 times and Progressive Robert La Follette carrying his home state in 1924.
Wisconsin has cast its ballot for the winning presidential nominee in 31 of 41 elections, or 76 percent of the time.
Wisconsin US Senate and Presidential Nominee Winners, 1916-present
|
Year
|
US Senate
|
Party
|
President
|
Party
|
|
2004
|
Feingold
|
Dem
|
Kerry
|
Dem
|
|
2000
|
Kohl
|
Dem
|
Gore
|
Dem
|
|
1992
|
Feingold
|
Dem
|
Clinton
|
Dem
|
|
1988
|
Kohl
|
Dem
|
Dukakis
|
Dem
|
|
1980
|
Kasten
|
GOP
|
Reagan
|
GOP
|
|
1976
|
Proxmire
|
Dem
|
Carter
|
Dem
|
|
1968
|
Nelson
|
Dem
|
Nixon
|
GOP
|
|
1964
|
Proxmire
|
Dem
|
Johnson
|
Dem
|
|
1956
|
Wiley
|
GOP
|
Eisenhower
|
GOP
|
|
1952
|
McCarthy
|
GOP
|
Eisenhower
|
GOP
|
|
1944
|
Wiley
|
GOP
|
Dewey
|
GOP
|
|
1940
|
La Follette, Jr.
|
Prog
|
Roosevelt
|
Dem
|
|
1932
|
Duffy
|
Dem
|
Roosevelt
|
Dem
|
|
1928
|
La Follette, Jr.
|
GOP
|
Hoover
|
GOP
|
|
1920
|
Lenroot
|
GOP
|
Harding
|
GOP
|
|
1916
|
La Follette
|
GOP
|
Hughes
|
GOP
|
Data reflects results since popular vote U.S. Senate elections were introduced in Wisconsin in 1914. Table compiled by Smart Politics.
Follow Smart Politics on Twitter.
