Sharron’s Angle: Independents Find Little Success in Nevada US House Races
Only seven candidates from Nevada have run for the U.S. House as an independent since statehood; none have eclipsed 15 percent

All of this, of course, is new ground in Nevada, which is one of just two states in U.S. history never to have held a special election in a U.S. House contest.
However, with a primary option seemingly banned by state law in this circumstance, Miller’s announcement will set the stage as to whether a) political parties will have the power to set the rules to determine their single nominee or b) whether a more ‘open ballot’ free for all ensues, in which candidates with the requisite number of signatures will have their name on the ballot.
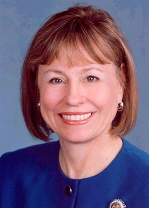
Sharron Angle, who had already announced her candidacy for the seat in the 2012 general election, has now declared she will run in the September special.
Angle has denied recent reports that she would run as an independent if Option A above is instituted (and she failed to receive the GOP nomination as many expect she would).

Despite her strong name recognition, Nevada’s electoral history does not suggest an independent Angle candidacy would have much success, with a former state Supreme Court justice among those who launched failed U.S. House bids as independents in the Silver State.
A Smart Politics review of the 95 at-large and district U.S. House races that have been conducted in Nevada since statehood finds independents have achieved ballot access just seven times and never once reached the 15 percent mark.
Overall, 280 candidates have appeared on the ballot in Nevada elections to the nation’s lower legislative chamber across the last 147 years dating back to 1864.
Only seven candidates have not been affiliated with a major or minor political party.
The best showing by an independent came during the Democratic wave of the 1930s.
In the 1936 Nevada U.S. House at-large race, Harry Austin notched 14.7 percent while Democratic incumbent Harry Scrugham was en route to his third term winning 58.4 percent and defeating Republican challenger Ed Peterson by 31.6 points.
On only two other occasions have independents cracked the double-digit mark in Nevada House races – with both of these taking place more than 90 years ago.
In 1908, Nevada Supreme Court Justice A.L. Fitzgerald won 12.7 percent – good for third place in a four man field – as 1-term Democratic incumbent George Bartlett was reelected with a plurality 47.3 percent of the vote.
Fitzgerald’s 34.6-point deficit off Bartlett’s winning total represents the closest an independent has ever come to winning a U.S. House race in Nevada.
In 1920, Paul Jones received 12.5 percent of the vote in a four candidate field that saw Republican Samuel Arentz upend 1-term Democratic incumbent Charles Evans by 14.8 points with 48.9 percent of the vote.
Only four other candidates have qualified to run as an independent across the remaining 92 Nevada U.S. House races – all of them launching campaigns during the last decade.
None, however, have had the moderate success of the three independents mentioned above who campaigned during the first four decades of the 20th Century:
· In 2002’s election to the newly created 3rd CD, Pete O’Neil won 3.8 percent of the vote as an independent in the first of Republican Jon Porter’s three victories. O’Neil finished third in a five-candidate field.
· In 2006, Daniel Rosen won 2.4 percent in the Silver State’s 2nd CD race, finishing third out of four candidates while Republican Dean Heller (whose seat will soon be vacant) won his first term with 50.3 percent of the vote.
· In 2008, Jeffrey Reeves received 4.3 percent as Rep. Porter lost his bid for a fourth term in the 3rd CD to Democrat Dina Titus, who won with 47.3 percent. Reeves placed third out of six candidates.
· In 2010, Barry Michaels won 2.4 percent of the vote placing third out of five candidates as Rep. Titus lost her 3rd CD seat to Republican Joe Heck, with the GOPer winning a plurality 48.1 percent.
The one constant feature across all of these seven U.S. House contests is that although the independent candidates were far from winning these races, they performed better than every third party candidate on the ballot in each cycle.
The historical data also suggests independent candidacies seem to pop up in volatile election cycles: there has been a change in partisan control of the U.S. House seat in three of the seven races with independents on the ballot (in 1920, 2008, and 2010).
Moreover, winning candidates received only a plurality of the vote in four of these races featuring independents (in 1908, 1920, 2008, 2010).
Of course, the fear Republicans have with a Sharron Angle candidacy (either in a crowded field of candidates or as an independent) is that she will dilute the conservative vote and thus enable a Democrat to win the race and pick up the seat.
That fear may be legitimate with a well-known candidate like Sharron Angle, however the independent vote has been larger than the margin of victory in just one race to date (2010).
Under its current district lines, NV-02 has a Partisan Vote Index of +5 GOP, making it the 178th most Republican district in the nation.
Independent Candidacies in Nevada U.S. House Races, 1864-2010
|
Year
|
District
|
Candidate
|
%
|
Place
|
# Candidates
|
MoL
|
|
1936
|
NV-AL
|
Harry Austin
|
14.7
|
3
|
3
|
-43.7
|
|
1908
|
NV-AL
|
A.L. Fitzgerald
|
12.7
|
3
|
4
|
-34.6
|
|
1920
|
NV-AL
|
Paul Jones
|
12.5
|
3
|
4
|
-36.5
|
|
2008
|
NV-03
|
Jeffrey Reeves
|
4.3
|
3
|
6
|
-43.2
|
|
2002
|
NV-03
|
Pete O’Neil
|
3.8
|
3
|
5
|
-52.3
|
|
2010
|
NV-03
|
Barry Michaels
|
2.4
|
3
|
5
|
-45.7
|
|
2006
|
NV-02
|
Daniel Rosen
|
2.4
|
3
|
4
|
-48.0
|
Table compiled by Smart Politics.
Follow Smart Politics on Twitter.
