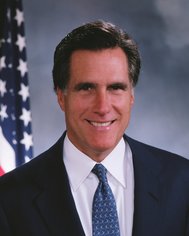
Romney Carries Illinois Primary with Lowest Ever Winning Percentage
The former Massachusetts governor becomes one of just three winners in 100 years of the primary to fail to reach the 50 percent mark

Compared to Ohio (0.9 points) and Michigan (3.2 points), Romney’s double-digit victory in Illinois was relatively comfortable.
However, when viewed through the lens of history, the former Massachusetts governor’s victory in the Prairie State reveals he turned in some of the least impressive numbers ever tallied for a winner of the state’s 100 year-old primary.
A Smart Politics study of Illinois Republican primary election returns finds Mitt Romney was victorious with the lowest percentage of the vote in the 26 cycles of the primary dating back to 1912.
With 99 percent of precincts reporting, Romney carried the state with just 46.7 percent of the vote – the lowest winning total in 100 years of presidential primaries in the state.
Only two other winners of the state’s GOP primary have failed to win a majority of the vote: Ronald Reagan in 1980 (48.5 percent) and John McCain in 2008 (47.5 percent).
With Rick Santorum coming in second at 35.0 percent, Romney’s margin of victory was also historically quite narrow.
The 11.7-point Romney Illinois win is tied for the second most narrowly decided finish across the 26 cycles of the state’s presidential primary.
Only publisher Frank Knox’s 7.9-point win over Idaho U.S. Senator William Borah in 1936 was more closely contested in a state that has averaged 58-point victory margins over the decades.
The Romney win was tied with and Reagan’s 11.7-point victory over Illinois Congressman John Anderson in 1980.
In terms of raw vote, with a few precincts yet to report in Cook County as well as all of Macoupin County, the 2012 contest appears to be slated for the fifth largest turnout in state history.
With more than 917,000 votes tallied to date, only the primaries of 1952 (1.27 million), 1928 (1.18 million), 1980 (1.12 million), 1940 (977,777), and 1924 (919,082) had more voters, with this year’s contest likely to overtake the latter.
Romney did decidedly better in Illinois than his father, George Romney, some 44 years ago. The elder Romney came in 7th place with 16 write-in votes in the state’s 1968 primary – three and a half months after exiting the race in February.
Smallest Winning Percentage in Illinois Republican Primary, 1912-2012
|
Year
|
Winner
|
%
|
MoV
|
|
2012
|
Mitt Romney
|
46.7
|
11.7
|
|
2008
|
John McCain
|
47.5
|
18.9
|
|
1980
|
Ronald Reagan
|
48.5
|
11.7
|
|
1920
|
Frank Lowden
|
50.5
|
16.5
|
|
1936
|
Frank Knox
|
53.7
|
7.9
|
|
1988
|
George H.W. Bush
|
54.7
|
18.7
|
|
1924
|
Calvin Coolidge
|
58.0
|
16.0
|
|
1976
|
Gerald Ford
|
58.9
|
18.8
|
|
1912
|
Teddy Roosevelt
|
61.1
|
31.9
|
|
1964
|
Barry Goldwater
|
62.0
|
36.7
|
|
1996
|
Bob Dole
|
65.1
|
42.3
|
|
2000
|
George W. Bush
|
67.4
|
45.9
|
|
1952
|
Robert Taft
|
73.6
|
61.4
|
|
1992
|
George H.W. Bush
|
76.4
|
53.9
|
|
1968
|
Richard Nixon
|
78.1
|
68.4
|
|
1916
|
Lawrence Sherman
|
90.1
|
81.2
|
|
1944
|
Douglas MacArthur
|
92.0
|
85.7
|
|
1956
|
Dwight Eisenhower
|
94.9
|
90.8
|
|
1948
|
Riley Bender
|
96.9
|
94.9
|
|
1972
|
Richard Nixon
|
97.0
|
95.5
|
|
1928
|
Frank Lowden
|
99.4
|
99.0
|
|
1932
|
Joseph France
|
99.4
|
98.9
|
|
1940
|
Thomas Dewey
|
99.9
|
99.9
|
|
1960
|
Richard Nixon
|
99.9
|
99.9
|
|
1984
|
Ronald Reagan
|
99.9
|
99.9
|
|
2004
|
George W. Bush
|
100.0
|
100.0
|
|
—
|
Average
|
75.8
|
57.9
|
Table compiled by Smart Politics from data culled from the Illinois Secretary of State and Illinois State Board of Elections.
Follow Smart Politics on Twitter.

To say that support for Mitt Romney is less than enthusiastic is not really any exaggeration whatsoever, and these data once again prove that.
Also, the saying that eventually all will be forgotten and everyone will rally around and support Romney even if they didn’t before, is a fantasy. If they are reluctant up until now to support him, there is no reason to put blind faith in the idea they will support him eventually because “that’s what always happens”. In fact, it does not always happen, history has proven that repeatedly.
Thanks for this illuminating table. Is there any way to get a county by county participation rate to compare counties to previous campaigns? I understand turnout in Chicago was depressed yesterday. I would like to compare turnout to other Illinois counties. Thanks again.