Will Arizona Democrats Hold Their Undefeated Special Election Victory Streak?
Democrats in Arizona have won all three special elections to Congress since statehood, but are victorious in only 35 percent of U.S. House elections over the last 60 years

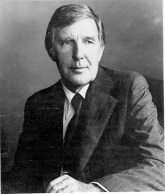
The two-candidate field pits Giffords’ former staffer Ron Barber (pictured) against Republican and failed 2010 nominee Jesse Kelly, an Iraq War veteran.
While the race will not substantively impact the 52-seat advantage Republicans currently hold in the House (242 seats to 190 for the Democrats), there is sure to be extra scrutiny in a competitive race such as AZ-08 (just like in the Wisconsin recall last week), which prognosticators use as a weather balloon for the all-important 2012 general election to be held less than five months from now.
In addition to trying to hold their seat and thus perhaps gain an advantage in the 8th CD race this fall, Democrats will also be attempting to keep their unblemished streak alive in special elections in the State of Arizona.
A Smart Politics analysis finds Arizona has held 205 elections to the U.S. Senate and U.S. House since statehood, with only three of these being special elections prior to Tuesday’s contest.
All three previous instances involved the resignation of a Democratic U.S. Representative, and in all three cases the Democratic Party held the seat.
The first federal special election in the Grand Canyon State took place in 1933 after the resignation of three-term Democratic U.S. Representative Lewis Douglas. (Democrats had won the first 12 U.S. House races up to this point in state history).
Douglas decisively won election to the state’s at-large seat in 1926, 1928, 1930, and 1932 with an average 74.1 percent of the vote.
However, Douglas was not seated at the beginning of what would be his fourth term in the 73rd Congress in March 1933, as he resigned to become President Franklin Roosevelt’s Director of the Budget.

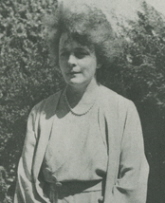
Greenway, a former Democratic National committeewoman from Arizona, easily held the seat for her party – winning 73.6 percent of the vote with the Socialist Sumpter in second with 16.9 percent and the GOPer Wilkinson in third with just 9.5 percent.
Greenway was the 17th woman elected to the U.S. House, and won one more term in 1934 and then opted not to run for reelection in 1936.
It would be nearly 30 years before the next federal special election in Arizona – and it also involved presidential politics.
In 1961, four-term Democratic U.S. Representative Stewart Udall resigned his 2nd CD seat to become Secretary of the Interior under John Kennedy.
Udall would hold that post through both Johnson administrations until January 1969.

Mo Udall would win the next 15 races through the Election of 1990.
The only other special election in Arizona history occurred in May 1991, when Udall retired six months after being elected to his 16th term due to his on-going battle with Parkinson’s disease.
In the election held that September, Democrat Ed Pastor won 55.5 percent of the vote to hold the seat in his race against Republican Pat Connor, who carried 44.4 percent.
Democrats won the first 27 U.S. House races in Arizona history, but have won just 51 against 92 losses since, or a shade over one-third of the contests (35.7 percent).
Overall, Republicans have won 92 of the 170 elections to the nation’s lower legislative chamber in the state (54.1 percent) compared to 78 for the Democrats (45.9 percent).
Electoral Victories in Arizona Congressional Districts by Party, 1911-Present
|
District
|
Election cycles
|
DEM
|
GOP
|
Total
|
|
At large
|
1911-1946
|
23
|
0
|
23
|
|
1
|
1948-present
|
4
|
28
|
32
|
|
2
|
1948-present
|
29
|
5
|
34
|
|
3
|
1962-present
|
5
|
21
|
26
|
|
4
|
1972-present
|
5
|
15
|
20
|
|
5
|
1982-present
|
3
|
12
|
15
|
|
6
|
1992-present
|
1
|
9
|
10
|
|
7
|
2002-present
|
5
|
0
|
5
|
|
8
|
2002-present
|
3
|
2
|
5
|
|
|
Total
|
78
|
92
|
170
|
Table compiled by Smart Politics.
Follow Smart Politics on Twitter.
