2,445 US Representatives Who Served with John Dingell
From Watkins Abbitt to John Zwach, Dingell has worked alongside nearly 2,500 different elected men and women over the last 21,000 days in the nation’s lower legislative chamber
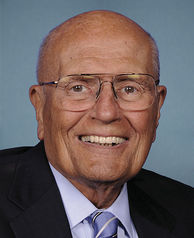
 Michigan congressman John Dingell received a lot of press on Friday as he passed the late West Virginia Democrat Robert Byrd for the most days served in Congress in U.S. history.
As of Monday, Dingell reached 21,000 days of service, or 57 years, 5 months, and 28 days.
Representative Dingell won a special election in December 1955 after the death of his father, 12-term Representative John Sr., and has won reelection 29 times since.
(Note: Dingell was actually not sworn in until January 3, 1956, but House tradition counts his seniority start date – and his 21,000 days – at his election date, not his swearing-in date).
Along the way, Dingell has seen many faces come and go in the nation’s lower legislative chamber.
And just how many Representatives has the Dean of the U.S. House served with over the last 21,000 days?
A Smart Politics analysis of data culled from the Biographical Directory of the United States Congress finds John Dingell has served alongside 2,445 different U.S. Representatives thus far during his 57+ years in the House.
Excluding delegates, Dingell has served with:
· 2,223 men and 222 women.
· 1,253 Democrats, 1,174 Republicans, and 18 Representatives who either switched parties or served as independents.
Dingell has thus far served with 88 Representatives from his home state of Michigan which ranks as the eighth most of any state over these nearly 57 and one-half years.
In first is California with 210 Representatives who have shared the House floor with Dingell followed by New York with 196, Pennsylvania with 139, Texas with 127, Illinois with 122, Ohio with 115, Florida with 91, Michigan with 88, New Jersey with 70, and North Carolina with 68.
That’s a lot of names for one man to remember from California alone – although Dingell might be able to recall all of the Representatives he has served with from Alaska, which has had only four Representatives since statehood in 1959 and perhaps even Delaware, Vermont, and Wyoming (eight each).
Number of U.S. Representatives to Serve with John Dingell by State
|
State
|
#
|
|
California
|
210
|
|
New York
|
196
|
|
Pennsylvania
|
139
|
|
Texas
|
127
|
|
Illinois
|
122
|
|
Ohio
|
115
|
|
Florida
|
91
|
|
Michigan
|
88
|
|
New Jersey
|
70
|
|
North Carolina
|
68
|
|
Georgia
|
66
|
|
Indiana
|
66
|
|
Virginia
|
52
|
|
Tennessee
|
50
|
|
Maryland
|
48
|
|
Missouri
|
48
|
|
Massachusetts
|
47
|
|
Louisiana
|
46
|
|
Washington
|
46
|
|
Wisconsin
|
44
|
|
Minnesota
|
43
|
|
Connecticut
|
42
|
|
Alabama
|
39
|
|
Iowa
|
39
|
|
Colorado
|
38
|
|
Kansas
|
37
|
|
South Carolina
|
37
|
|
Kentucky
|
36
|
|
Oklahoma
|
33
|
|
Arizona
|
31
|
|
Arkansas
|
28
|
|
Mississippi
|
27
|
|
Oregon
|
26
|
|
Nebraska
|
24
|
|
Utah
|
22
|
|
Maine
|
20
|
|
West Virginia
|
20
|
|
New Mexico
|
19
|
|
Idaho
|
18
|
|
New Hampshire
|
18
|
|
Nevada
|
16
|
|
South Dakota
|
15
|
|
Hawaii
|
13
|
|
Montana
|
13
|
|
North Dakota
|
13
|
|
Rhode Island
|
12
|
|
Delaware
|
8
|
|
Vermont
|
8
|
|
Wyoming
|
8
|
|
Alaska
|
4
|
|
Total
|
2,446*
|
* Edgar Foreman served from both Texas and New Mexico and is therefore counted in the tally for each state. Note: Excludes delegates. Table compiled by Smart Politics.

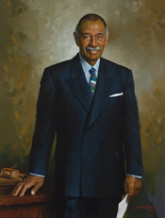
Conyers has been in office since January 1963 winning 25 U.S. House contests and has served with Dingell for the last 48 years, 5 months, 7 days and counting.
The member of the U.S. House with whom Dingell served the fewest number of days was 11-term Republican Chauncey Reed of Illinois in the 84th Congress.
Reed died on February 9, 1956, or 37 days after Dingell was sworn into office.
(Note: New York Democratic Representative Sidney Fine resigned 20 days after Dingell’s election to Congress on January 2, 1956 – but the two did not technically serve in the House together as Dingell was sworn in one day later).
And will Dingell add to this 2,445 tally in 2015?
Presuming he wants to serve for a 31st term, there seems to be no stopping southeastern Michigan’s record-holding congressman.
Dingell has been elected by an average margin of victory of 46.9 points across the 30 contests of his congressional career.
During the Republican tsunami of 2010, he faced his most competitive race ever with a 16.7-point victory that cycle, but rebounded with a 38.9-point win in the newly drawn 12th CD in 2012.
Over these 30 contests Dingell has averaged 72.6 percent of the vote while his Republican opponents have averaged just 25.6 percent.
Since Dingell’s first victory in the special election of 1955 to fill his father’s seat after his death, he has defeated a total of 77 challengers: 28 Republicans, 14 Libertarians, and five candidates from the U.S. Taxpayers, American Independent, and Socialist Workers parties, four from the Natural Law Party, three from the Green, Socialist Labor, and Prohibition parties, two from the U.S. Labor party, and five other independent or third party candidates.
John Dingell Margin of Victory in U.S. House Races, 1955-2012
|
Year
|
District
|
Dingell
|
GOP
|
3rd
|
MoV
|
|
2012
|
12
|
67.9
|
29.0
|
3.1
|
38.9
|
|
2010
|
15
|
56.8
|
40.1
|
3.1
|
16.7
|
|
2008
|
15
|
70.7
|
25.0
|
4.3
|
45.7
|
|
2006
|
15
|
88.0
|
0.0
|
12.0
|
83.9
|
|
2004
|
15
|
70.9
|
26.6
|
2.5
|
44.3
|
|
2002
|
15
|
72.2
|
25.7
|
2.1
|
46.5
|
|
2000
|
16
|
71.0
|
26.5
|
2.5
|
44.5
|
|
1998
|
16
|
66.6
|
31.0
|
2.4
|
35.6
|
|
1996
|
16
|
62.0
|
35.7
|
2.3
|
26.3
|
|
1994
|
16
|
59.1
|
39.8
|
1.1
|
19.3
|
|
1992
|
16
|
65.1
|
31.4
|
3.5
|
33.7
|
|
1990
|
16
|
66.6
|
31.9
|
1.5
|
34.7
|
|
1988
|
16
|
97.4
|
0.0
|
2.6
|
97.4
|
|
1986
|
16
|
77.8
|
22.2
|
0.0
|
55.6
|
|
1984
|
16
|
63.7
|
35.7
|
0.5
|
28.0
|
|
1982
|
16
|
73.7
|
25.3
|
1.0
|
48.4
|
|
1980
|
16
|
69.9
|
28.2
|
1.9
|
41.7
|
|
1978
|
16
|
76.5
|
22.0
|
1.5
|
54.5
|
|
1976
|
16
|
75.9
|
22.7
|
1.4
|
53.2
|
|
1974
|
16
|
77.7
|
20.5
|
1.8
|
57.2
|
|
1972
|
16
|
68.1
|
29.8
|
2.1
|
38.3
|
|
1970
|
16
|
79.1
|
20.9
|
0.0
|
58.2
|
|
1968
|
16
|
73.9
|
25.9
|
0.2
|
48.0
|
|
1966
|
16
|
62.7
|
37.3
|
0.0
|
25.4
|
|
1964
|
16
|
73.4
|
26.5
|
0.1
|
46.9
|
|
1962
|
15
|
83.0
|
17.0
|
0.0
|
66.0
|
|
1960
|
15
|
79.4
|
20.3
|
0.3
|
59.1
|
|
1958
|
15
|
78.5
|
21.2
|
0.3
|
57.3
|
|
1956
|
15
|
74.1
|
25.8
|
0.1
|
48.3
|
|
1955
|
15
|
76.1
|
23.6
|
0.3
|
52.5
|
|
Average
|
|
72.6
|
25.6
|
1.8
|
46.9
|
Table compiled by Smart Politics with data culled from the Office of the Clerk of U.S. House of Representatives.
For a complete list of the nearly 2,500 U.S. Representatives to serve with John Dingell click here.
Follow Smart Politics on Twitter.

What has he done for the State of Michigan in 57+ years? Isn’t that the question?