African-American US Representatives by the Numbers
Maryland has elected blacks to the U.S. House at the highest percentage in the nation since 1870; 25 states have yet to elect any African-Americans to the chamber
 Leading up to the 50th Anniversary of Martin Luther King’s “I Have a Dream” speech, there has been significant discussion on the state of race relations and racial equality in the country and the degree of progress that has been made over the last half-century.
Related to that discussion is the representation of African-Americans in elected office, particularly at the federal level.
The most glaring statistic in that regard is that only three states have elected blacks to the U.S. Senate in American history (Illinois, Massachusetts, and Mississippi) and just two states since Reconstruction.
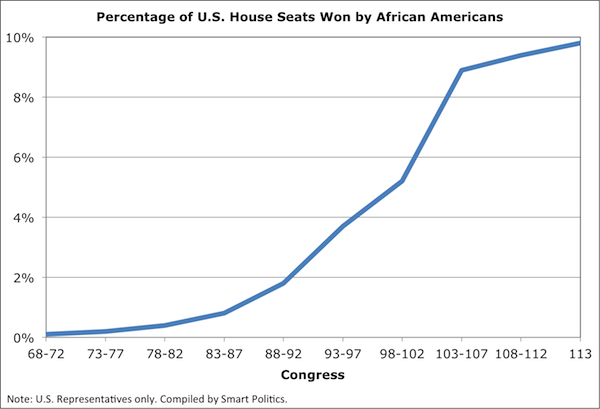
Due in part to redistricting efforts in recent decades, African-Americans have, however, gradually increased their numbers in the U.S. House, and now hold 10 percent of seats in the chamber while making up 13 percent of the population.
However, 25 states have yet to elect an African-American to the U.S. House and 49 percent of the total number of U.S. House elections won by blacks in history have come from five states: New York, California, Illinois, Michigan, and Georgia.
After the election of blacks in 38 U.S. House contests from 1870 until the end of the 19th Century, none served in the chamber until 1929 when Illinois Republican Oscar De Priest won the state’s 1st Congressional District.
Since then, the percentage of seats won by African-Americans has increased during each subsequent 10-year redistricting period culminating with the 43 black U.S. Representatives (9.8 percent) who have been elected to serve in the U.S. House for the 113th Congress (although two did not serve: Jesse Jackson, who resigned, and Tim Scott, who was appointed to the U.S. Senate).
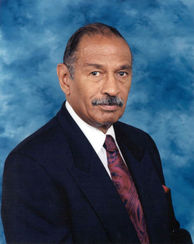
Michigan’s John Conyers (pictured at top) is the longest serving African-American Congressman in history – currently in his 25th term.
New York’s Charlie Rangel is second at 22 terms followed by former Missouri U.S. Representative Bill Clay at 16 terms.
By Geographical Region
During the 2012 cycle, Nevada became the 25th state to send an African-American to the House of Representatives when Stephen Horsford was victorious in the state’s newly-created 4th Congressional District.
Nevada is just one of two Western states that have elected a black to the House, along with California which has elected a dozen different members including three this past cycle (Karen Bass, Barbara Lee, and Maxine Waters).
Western states, of course, tend to be less populated and many have low African-American populations, which has limited the election of blacks in this region.
(Examples of U.S. Representatives who are elected in districts without significant or majority black populations tend to be rare).
States that have never elected an African American to the U.S. House are spread out across all four regions of the country (regions as designated by the U.S. Census Bureau):
· Five states in the Midwest: Iowa, Kansas, Nebraska, North Dakota, and South Dakota
· Five states in the Northeast: Maine, Massachusetts, New Hampshire, Rhode Island, and Vermont
· Four states in the South: Arkansas, Delaware, Kentucky, and West Virginia.
· Eleven states in the West: Alaska, Arizona, Colorado, Hawaii, Idaho, Montana, New Mexico, Oregon, Utah, Washington, and Wyoming.
By State
A total of 127 African-Americans have been elected U.S. Representative in the history of the country.
Illinois – the only state to elect two blacks to the Senate in the popular vote era – has elected the largest number with 15.
California is next with 12 followed by South Carolina and New York with 10 and Georgia and North Carolina with eight.
Some southern states populate the top of the list due to several black U.S. Representatives getting elected during Reconstruction to the end of the 1800s.
Twenty different African-Americans were elected during this span with eight in South Carolina, four in North Carolina, three in Alabama, and one each in Florida, Georgia, Louisiana, Mississippi, and Virginia.
Overall, these 127 African-American representatives have collectively won 746 elections to the House of Representatives – 90 in New York, 89 in California, 86 in Illinois, 55 in Michigan, and 46 in Georgia.
The election of blacks in these five states represents 49 percent of all such contests won in U.S. history.
By Percentage of Seats Won
Since the first black won election to the U.S. House in 1870 (Republican Joseph Rainey of South Carolina), Maryland has elected the highest percentage of blacks to the chamber at 7.2 percent.
A quarter of Maryland’s eight-member delegation has been African-American since the 1992 cycle and the state is currently represented by 10-term Democrat Elijah Cummings and four-term Democrat Donna Edwards.
South Carolina is next at 7.1 percent, although 19 of the 32 contests won by blacks in the Palmetto State took place in the 19th Century.
Georgia is next at 6.0 percent, followed by Florida at 5.5 percent, Michigan and Illinois at 5.2 percent, and California at 4.9 percent.
Of the 25 states that have elected at least one black to the House of Representatives, Minnesota and Wisconsin have done so at the lowest rate (0.7 percent), followed by Connecticut (0.8 percent), Nevada (1.0 percent), and Oklahoma (1.2 percent).
Percentage of U.S. House Races Won by African-Americans by State, 1870-present
|
State
|
#
|
DEM
|
GOP
|
# Seats won
|
% Seats Won
|
|
Maryland
|
5
|
5
|
0
|
35
|
7.2
|
|
South Carolina
|
10
|
1
|
9
|
32
|
7.1
|
|
Georgia
|
8
|
7
|
1
|
46
|
6.0
|
|
Florida
|
7
|
5
|
2
|
37
|
5.5
|
|
Michigan
|
6
|
6
|
0
|
55
|
5.2
|
|
Illinois
|
15
|
14
|
1
|
86
|
5.2
|
|
California
|
12
|
12
|
0
|
89
|
4.9
|
|
North Carolina
|
8
|
4
|
4
|
31
|
4.1
|
|
Mississippi
|
3
|
2
|
1
|
18
|
4.0
|
|
Missouri
|
4
|
4
|
0
|
34
|
3.8
|
|
New York
|
10
|
10
|
0
|
90
|
3.3
|
|
Texas
|
7
|
7
|
0
|
39
|
2.7
|
|
Louisiana
|
4
|
3
|
1
|
14
|
2.7
|
|
Tennessee
|
2
|
2
|
0
|
16
|
2.4
|
|
Alabama
|
6
|
3
|
3
|
14
|
2.3
|
|
Virginia
|
2
|
1
|
1
|
12
|
1.7
|
|
New Jersey
|
2
|
2
|
0
|
14
|
1.6
|
|
Ohio
|
4
|
4
|
0
|
25
|
1.6
|
|
Pennsylvania
|
4
|
4
|
0
|
30
|
1.5
|
|
Indiana
|
3
|
3
|
0
|
12
|
1.4
|
|
Oklahoma
|
1
|
0
|
1
|
4
|
1.2
|
|
Nevada
|
1
|
1
|
0
|
1
|
1.0
|
|
Connecticut
|
1
|
0
|
1
|
3
|
0.8
|
|
Wisconsin
|
1
|
1
|
0
|
5
|
0.7
|
|
Minnesota
|
1
|
1
|
0
|
4
|
0.7
|
|
Total
|
127
|
102
|
25
|
746
|
|
Table compiled by Smart Politics.
By Party
In total, 102 of the 127 black U.S. Representatives have been Democrats (80 percent) while 25 have been Republicans (20 percent).
The only Republicans to serve in the 20th or 21st Centuries were Oscar De Priest of Illinois, Gary Franks of Connecticut, Tim Scott of South Carolina, J.C. Watts of Oklahoma, and Allen West of Florida.
West’s defeat in the 2012 cycle and Scott’s appointment to the U.S. Senate in January 2013 means that all African-American U.S. Representatives in the 113th Congress are Democrats.
Follow Smart Politics on Twitter.


Interesting facts. One correction … Delaware isn’t in the South.
Actually, as described above, Delaware is listed as a Southern state as per U.S. Census regional designations.
Yes it is.
Hello, I am the webmaster for the Black Caucus for the California Colleges. I created the Dot Black company out of Palo Alto California where fed the TLD suffix of into an estimated 300 some odd modems and over 1,000 servers. As a demonstraion I would like to work with the researchers of this website to create a datebase and profile directory of all the elected or appointed African American or Black members of the House of Representives, Congress and Senate as of 2016 for http://www.Government.black My phone number is 310.722.9952 ~ Stefan Lambert
My name is Kenneth L.Bush; I am seeking the GOP Nomination in 2018 for the Minnesota State Legislature House District 25B. If endorsemed and Win, I will be the first and only black republican representative at the Capital. Our state is ready for hardworking civic-minded individuals to step up and do!
I am an African American and I am running for State Rep in Framinghsm, Massachusetts. Can you please email me the accurate number of how many blacks was elected from Framingham Mass as a State Rep.?? And where you got the results from? Thank You so much.
This article needs wide circulation on social media.
In Minnesota, We the People had our caucus to choose our delegates to select a candidate at the endorsement convention. On Tuesday Feb 6, 2018 I was elected by my peers as a Republican Delegate of Rochester, Minnesota – Ward 5 and chair of our precinct (6). There is some progress for MN as stated in my previous posting as my hope is that the people of our community will have the leadership in these regards and endorse me at the Olmsted County Republican convention as the GOP candidate for Minnesota House of Representatives and together, We can continue to move our great state forward. Note: In understanding, We still have a long way to go, and I am trying my best to do my part in bringing the People Together!
Please follow my campaign or visit;
http://www.kennethlbush.com
It is official and the American Dream is Real. We are about to make history by being the First African American Republican elected to the Minnesota Legislature to “ Serve the People at the State House since 1899. This is a testament to the great people of Rochester, Minnesota the place I was raised and to the people who cared, helped me grow, And never gave up on me. Vote in November 2018 for Kenneth Bush to be State Representative District 25B. “ Together We Can”
https://m.facebook.com/kennethlbush
It would be nice to see the the dates as to when these representatives and senators were voted in and have it additionally broken down into Representative and Senator as opposed to lumping all of the numbers together which doesn’t give a good picture and representation and Sen and Rep by party as well, which would further define the set.