The Revolution Continues: 3rd Party and Independent US Senate Candidacies in 2 Charts
The rate of third party and independent U.S. Senate candidacies over the last two decades has increased 60+ percent compared to the first 75 years of the direct election era; 2014 may make the biggest splash yet

The two aforementioned independents are, of course, businessman Greg Orman of Kansas and former three-term GOP U.S. Senator Larry Pressler of South Dakota.
As previously reported at Smart Politics, if either Orman or Pressler is victorious, it would be the first time in history that three independents served in the U.S. Senate at the same time (joining Angus King of Maine and Bernie Sanders of Vermont) and the first time since 1940 in which three non-major party officeholders served in the chamber.
While no other third party or independent candidates are threatening to contend for a Senate seat in 2014, several are in a position to win at least five percent of the vote and/or perhaps influence the outcome of the race, such as:
● Alaska Libertarian Mark Fish
● Georgia Libertarian Amanda Swafford
● Kentucky Libertarian David Patterson
● North Carolina Libertarian Sean Haugh
● South Carolina independent Thomas Ravenel
● Virginia Libertarian Robert Sarvis
And although the number of non-major party candidates who achieved ballot access in 2014 did not set an all-time record, the cycle does continue a two-decade long trend whereby such candidates have found greater success in getting on the ballot in U.S. Senate races.
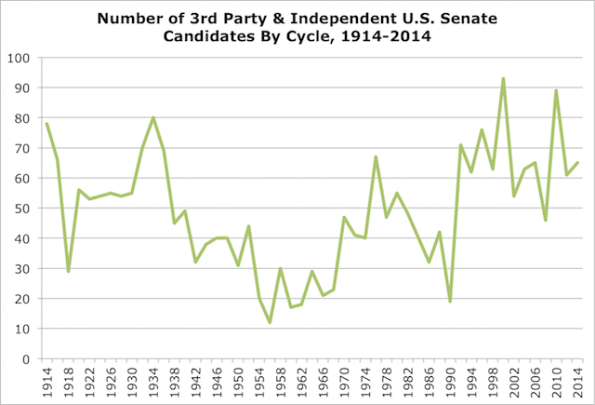
Smart Politics examined the more than 1,800 U.S. Senate elections conducted in presidential and midterm election cycles over the last 100 years and found that nine of the Top 15 cycles with the highest rate of third party and independent candidacies have taken place since 1992.
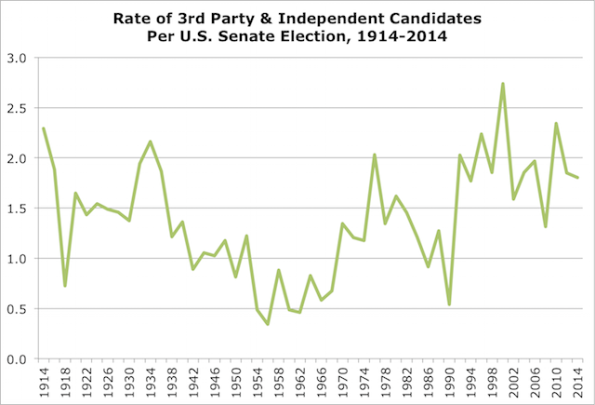
To calculate the rate of non-major party candidacies over more than 50 election cycles, Smart Politics tallied the number of third party and independent U.S. Senate candidates on the ballot in each midterm and presidential election cycle and divided that by the total number of general and special U.S. Senate elections conducted that fall. (Note: Write-in candidates were excluded from the analysis except in the handful of contests in which such a candidate received at least one percent of the vote).
The cycle with the highest rate of minor party or independent candidates came 14 years ago in 2000 when 93 non-major party U.S. Senate candidates appeared on the ballot across 34 races, or 2.74 per contest.
The 2000 election found nine independent and/or third party candidates gain ballot access in New Jersey, with six in New York, and five each in California, Florida, Michigan, Minnesota, Tennessee, and Vermont.
And how high does the 2014 cycle rank?
The rate of independent and third party candidates in U.S. Senate elections in 2014 comes in at #15 out of the 51 election cycles since 1914, with 65 such candidates on the ballot this November across the cycle’s 36 races, or 1.81 per race.
According to official state election candidate lists, Tennessee leads the way with 10 non-major party candidates on the ballot followed by New Jersey with five and Colorado and Iowa with four (although Hawkeye State Libertarian nominee Doug Butzier died in a plane crash earlier this month he remains on the ballot).
It should also be noted that six races this November will tie or set state records for the most third party and independent U.S. Senate candidates: Arkansas (two), Nebraska (two), Tennessee (10), Texas (two), West Virginia (three), and Wyoming (two).
Overall, this year’s U.S. Senate election continues the trend over the last few decades of a surge in the number of third party and independent candidacies.
Since 1992, an average of 1.95 non-major party candidates have appeared on the ballot in U.S. Senate races.
That marks a 61 percent increase from the average of 1.21 candidates who ran for the chamber in midterm or presidential election cycles from 1914 to 1990.
Several recent election cycles rank near the top with 2000 at #1 (2.74 candidates per election), 2010 at #2 (2.34), 1996 at #4 (2.24), 1992 tied for #6 (2.03), 2006 at #8 (1.97), 1998, 2004, and 2012 tied for #12 (1.85), and 2014 at #15 (1.81).
Rounding out the Top 15 is the 1914 cycle at #3 (2.29), 1934 at #5 (2.16), 1976 tied for #6 (2.03), 1932 at #9 (1.94), 1916 at #10 (1.89), and 1936 at #11 (1.86).

Follow Smart Politics on Twitter.

