Will Minnesota Have the Most Competitive Gubernatorial Race in the Nation for the 2nd Consecutive Election Cycle?
Gopher State could follow the nation’s closest gubernatorial race in 2006 and closest Senate race in 2008 with another nail-biter in 2010

That poll found Republican endorsee Tom Emmer leading (Margaret Anderson Kelliher, Matt Entenza) or trailing (Mark Dayton) each DFL hopeful within the margin of error – with no candidate receiving 40 percent of the vote. (Approximately 1 in 5 Minnesotans are still undecided).
Independence Party endorsee Tom Horner received 12 percent in all three matchup polls against Emmer and each DFLer.
Back in 2006, Minnesota’s gubernatorial election between Tim Pawlenty, Mike Hatch, and Peter Hutchinson was the most narrowly decided among the 36 such contests that year – with Pawlenty winning by just 1 point.
In 2008, the Gopher State was famously home to the most closely contested (and expensive) U.S. Senate race in the country, with Al Franken nipping Norm Coleman by a few hundred votes in a race that took more than seven months to decide through a recount and various court challenges.
And now the political stars seem to be aligning once again in 2010 for Minnesota to be the center of attention on Election Day: (national) momentum towards the GOP in a Democratic-leaning state mixed with a strong third party candidacy is a prescription for a late night watching returns come in.
But will Minnesota be the most competitive gubernatorial race across the country this year?
If it does, it would be quite a rarity.
A Smart Politics analysis of more than 900 gubernatorial elections across six decades finds that if Minnesota notches the most competitive race again in 2010, it will be the first state to do so in nearly 60 years.
All but five states (Kentucky, Louisiana, Mississippi, New Jersey, and Virginia) hold their gubernatorial elections in even-numbered years, with the majority of these states conducting such elections every four years.
Since the end of World War II, only one of these 45 states has had the nation’s most competitive gubernatorial race in back-to-back elections for that state: Michigan (1950, 1952).
In 1950 and 1952, Democrat Soapy Williams of Michigan won the 2nd and 3rd of his six terms in office, by a combined 0.36 percent.
In 1950, Williams edged out his Republican opponent Harry Kelly by just 1,154 votes out of nearly 1.9 million cast, or a victory margin of 0.06 percent. Two years later, Williams defeated GOPer Frederick Alger by 8,618 votes out of nearly 2.9 million votes cast (0.30 percent).
So what are the odds Minnesota’s race will be the most competitive across the country once again in 2010?
Early polls find the Gopher State among a handful around the country with likely major party nominees unable to command a lead outside of the poll’s margin of error, including California, Maryland, Connecticut, Colorado, Ohio, Georgia, New Mexico, and Michigan.
Contests in Maine, Oregon, Vermont, Wisconsin, and Florida – all with GOPers holding single-digit advantages – could tighten as well.

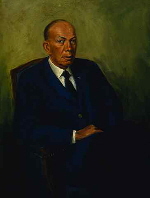
Rolvaag (pictured) won by just 91 votes (0.00 percent) – the narrowest margin of victory of the 35 gubernatorial contests on the ballot that year.
Most Competitive Gubernatorial Elections in Even-Numbered Years, 1946-2008
|
Year
|
State
|
MoV
|
|
2008
|
North Carolina
|
3.4
|
|
2006
|
Minnesota
|
1.0
|
|
2004
|
Washington
|
0.0
|
|
2002
|
Alabama
|
0.2
|
|
2000
|
Missouri
|
0.9
|
|
1998
|
Colorado
|
0.6
|
|
1996
|
West Virginia
|
5.8
|
|
1994
|
Alaska
|
0.3
|
|
1992
|
Montana
|
2.7
|
|
1990
|
Arizona
|
0.4
|
|
1988
|
Rhode Island
|
1.7
|
|
1986
|
Idaho
|
0.9
|
|
1984
|
Vermont
|
1.6
|
|
1982
|
Illinois
|
0.1
|
|
1980
|
Arkansas
|
3.9
|
|
1978
|
Texas
|
0.7
|
|
1976
|
Missouri
|
0.7
|
|
1974
|
Alaska
|
0.3
|
|
1972
|
Illinois
|
1.7
|
|
1970
|
Maine
|
0.3
|
|
1968
|
New Mexico
|
0.9
|
|
1966
|
Georgia
|
0.3
|
|
1964
|
Massachusetts
|
1.0
|
|
1962
|
Minnesota
|
0.0
|
|
1960
|
New Mexico
|
0.7
|
|
1958
|
Nebraska
|
0.4
|
|
1956
|
Rhode Island
|
0.2
|
|
1954
|
New York
|
0.2
|
|
1952
|
Michigan
|
0.3
|
|
1950
|
Michigan
|
0.1
|
|
1948
|
Connecticut
|
0.3
|
|
1946
|
Ohio
|
1.8
|
Table compiled by Smart Politics.
Follow Smart Politics on Twitter.
