Minnesota Ranks 10th in Nation in Campaign Contributions Per Congressional District in 2009
South Carolina tops list at $1.6 million per district with Minnesota 10th at $983,029; candidates in Northeastern congressional districts receiving the most money overall

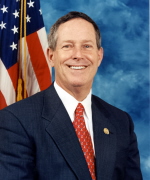
A Smart Politics analysis of Federal Election Commission data from January 1-December 31 finds that, at nearly $2.8 million, candidates in the Gopher State’s 6th Congressional District race received the sixth most funds in the nation last year, although this was still more than $2.5 million shy of the money raised in the 2010 rematch between Republican Joe Wilson and Democrat Rob Miller in South Carolina’s 2nd CD (leading the nation at ($5.4 million).
(This data excludes from analysis the five congressional districts which held special elections in 2009: candidates in districts CA-10, CA-32, IL-05, NY-20, NY-23 raised more than $18.5 million collectively last year).

Far behind the 6th CD in the Gopher State was the 3rd Congressional District, which came in at #66 nationwide. While freshman Congressman Erik Paulsen raised in excess of $1.1 million last year, the campaigns of his DFL challengers Maureen Hackett and James Meffert got off to later, and comparatively slower, starts than their DFL allies in the 6th CD, netting them less than $200,000 collectively, compared to the nearly $1.2 million raised by Clark and Reed in the 6th.
Candidates in Minnesota’s 8th CD ranked #128 in the country in funds raised, followed by the 1st CD at #172, the 2nd CD at #183, the 7th CD at #238, the 5th CD at #254, and the 4th CD at #330.
Overall, the most attractive contests for those contributing to U.S. House races were in the nation’s Northeastern states – candidates in the 81 Congressional Districts (excluding NY-20 and NY-23) across the states of Connecticut, Pennsylvania, New Hampshire, New York, Rhode Island, Massachusetts, New Jersey, Maine, and Vermont raised an average of $880,879 per district.
U.S. House candidates in the nation’s 12 Midwestern states followed with an average of $854,775 per congressional district, followed by the South at $780,874, and the West at $761,162.
In the Upper Midwest, North Dakota (whose at-large Democratic incumbent Earl Pomeroy is expected to face one of his most difficult races in years) came in at #7 in the nation ($1.15 million), with Wisconsin at #27 ($759,520 per district), South Dakota at #29 ($756,220), and Iowa at #42 ($606,563).
A Smart Politics analysis also found there to be little correlation between the amount of money raised per district in a state and the average margin of victory in U.S. House contests in the 2008 elections.
In fact, four states whose average margin of victory for U.S. House races in 2008 ranked in the Top 10 most competitive in the country, currently rank in the Bottom 10 in terms of 2009 fundraising.
For example, Alaska had the lowest average statewide margin of victory in 2008 (with its at-large U.S. House race decided by 5.1 points), but currently ranks #44 in average statewide fundraising per district.
Wyoming had the second lowest average statewide margin of victory for U.S. House races in 2008 (with its at-large race decided by 9.8 points), but currently ranks #50 in fundraising. Iowa (7th in 2008 MoV) and Maine (8th) also found themselves in the bottom 10 in average funds contributed to U.S. House candidates in 2009 per district.
There are a few states, however, who ranked among the leaders in both the lowest average margins of victory in 2008 and the highest average campaign contributions per House district in 2009.
South Carolina (#1), for example, had the 6th lowest average margin of victory in 2008, at 20.6 points per district. New Mexico (#3 in average funds raised) came in 4th in 2008 with an average margin of victory of 16.5 points. Nevada (#5 in average funds raised) had the 5th lowest average margin of victory in 2008 (18.2 points).
Overall, nearly $350 million was raised across the nation’ 430 U.S. House districts that did not hold special elections in 2009. Adding in the five districts that did hold special elections last year brings the total to just shy of $370 million.
Average Funds Raised Per U.S. House District by State, 2009
|
Rank
|
State
|
Average
|
2008 ave. MoV
|
MoV rank
|
|
1
|
South Carolina
|
$1,635,780
|
20.6
|
6
|
|
2
|
Connecticut
|
$1,352,485
|
32.0
|
25
|
|
3
|
New Mexico
|
$1,320,651
|
16.5
|
4
|
|
4
|
Kansas
|
$1,298,943
|
30.4
|
21
|
|
5
|
Nevada
|
$1,218,066
|
18.2
|
5
|
|
6
|
Virginia
|
$1,208,261
|
32.2
|
26
|
|
7
|
North Dakota
|
$1,153,666
|
24.0
|
12
|
|
8
|
Pennsylvania
|
$1,101,242
|
28.1
|
16
|
|
9
|
Idaho
|
$1,032,063
|
21.8
|
8
|
|
10
|
Minnesota
|
$983,029
|
27.6
|
15
|
|
11
|
Illinois*
|
$964,611
|
41.6
|
36
|
|
12
|
New Hampshire
|
$937,588
|
10.5
|
3
|
|
13
|
Maryland
|
$907,011
|
42.9
|
40
|
|
14
|
New York*
|
$895,231
|
46.0
|
42
|
|
15
|
Rhode Island
|
$866,575
|
42.3
|
37
|
|
16
|
Montana
|
$857,397
|
29.8
|
20
|
|
17
|
Alabama
|
$837,516
|
51.5
|
45
|
|
18
|
Arizona
|
$837,339
|
22.6
|
10
|
|
19
|
Ohio
|
$832,024
|
25.9
|
13
|
|
20
|
Florida
|
$823,792
|
31.1
|
23
|
|
21
|
Indiana
|
$812,825
|
28.6
|
17
|
|
22
|
Louisiana
|
$794,316
|
38.6
|
35
|
|
23
|
Michigan
|
$792,386
|
32.4
|
27
|
|
24
|
Missouri
|
$788,143
|
34.1
|
31
|
|
25
|
Tennessee
|
$785,213
|
52.3
|
47
|
|
26
|
Oregon
|
$768,693
|
47.4
|
43
|
|
27
|
Wisconsin
|
$759,520
|
36.3
|
33
|
|
28
|
Colorado
|
$757,529
|
26.0
|
14
|
|
29
|
South Dakota
|
$756,220
|
35.2
|
32
|
|
30
|
California*
|
$746,316
|
44.6
|
41
|
|
31
|
Delaware
|
$720,039
|
23.1
|
11
|
|
32
|
Mississippi
|
$707,508
|
30.9
|
22
|
|
33
|
Kentucky
|
$691,646
|
29.4
|
19
|
|
34
|
Massachusetts
|
$662,226
|
78.2
|
49
|
|
35
|
Washington
|
$660,561
|
31.3
|
24
|
|
36
|
Oklahoma
|
$658,390
|
37.6
|
34
|
|
37
|
Georgia
|
$645,586
|
42.8
|
39
|
|
38
|
Texas
|
$643,288
|
42.7
|
38
|
|
39
|
Nebraska
|
$636,629
|
33.1
|
28
|
|
40
|
Hawaii
|
$626,294
|
52.1
|
46
|
|
41
|
New Jersey
|
$619,258
|
34.0
|
30
|
|
42
|
Iowa
|
$606,563
|
20.9
|
7
|
|
43
|
Arkansas
|
$582,223
|
70.7
|
48
|
|
44
|
Alaska
|
$523,295
|
5.1
|
1
|
|
45
|
North Carolina
|
$494,696
|
29.0
|
18
|
|
46
|
West Virginia
|
$488,757
|
49.4
|
44
|
|
47
|
Maine
|
$421,868
|
21.8
|
8
|
|
48
|
Vermont
|
$369,254
|
78.4
|
50
|
|
49
|
Utah
|
$364,021
|
33.8
|
29
|
|
50
|
Wyoming
|
$327,721
|
9.8
|
2
|
* Data excludes money raised by candidates in the following congressional districts which held special elections in 2009: CA-10, CA-32, IL-05, NY-20, NY-23. Data includes money raised by incumbents in 2009 who later opted to not seek reelection in 2010, except for those U.S. Representatives who are seeking U.S. Senate seats. FEC data and election data compiled by Smart Politics.
Follow Smart Politics on Twitter.
