
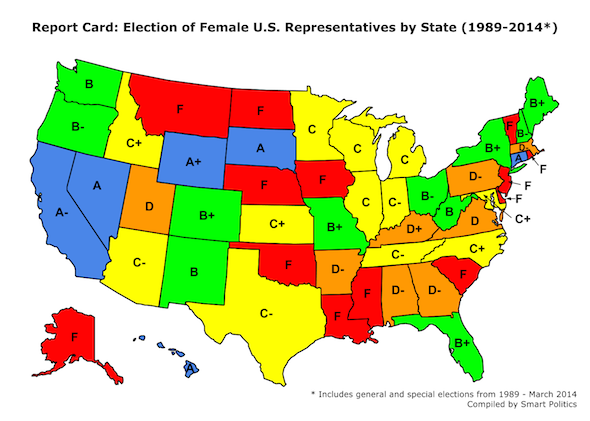
Gender Equality in the US House: A State-by State Quarter-Century Report Card (1989-2014)
A study of 5,325 congressional elections finds the number of female U.S. Representatives has more than tripled over the last 25 years, but the rate at which women are elected to the chamber still varies greatly between the states
 With her loss in Florida’s 13th Congressional District special election last week, Alex Sink failed in her chance to become the 15th woman elected to the U.S. House in state history and seventh female member of the current delegation.
But although Sink fell short in Florida, the state has fared far better than most – particularly in the South – when it comes to electing women to the chamber.
It has been widely reported that the 113th Congress is at a high water mark for the most ever female U.S. Representatives at 79 – more than tripling the number seated in the chamber just 25 years ago.
That number is expected to increase when the 114th Congress convenes in less than nine months as only a half-dozen female U.S. Representatives are (voluntarily) exiting the chamber to date.
Four are running for other political offices: Democrats Colleen Hanabusa of Hawaii, Allyson Schwartz of Pennsylvania, and Gloria Negrete McLeod of California and Republican Shelley Moore Capito of West Virginia. Two more are retiring: Republican Michele Bachmann of Minnesota and Democrat Carolyn McCarthy of New York.
From which states will women rebuild and expand their numbers in the chamber in the 2014 cycle?
If past is prologue, there are many states from which it is very unlikely to see a woman elected this November.
Smart Politics crunched the numbers over the last 25 years to highlight each state’s track record in electing women to the U.S. House, including a report card that compares each state’s relative success.
A Smart Politics review of the 5,325 U.S. House general and special elections conducted over the last 25 years finds that only one state has elected women to the chamber at a rate equal or greater to their percentage in the population, with 10 others electing women to at least one in five seats during this span.
Over the last quarter-century, the state that leads the nation in electing female U.S. House nominees is Wyoming – the Equality State. (Wyoming received its nickname as the first government to grant women the right to vote in 1869 while a U.S. territory).
Wyoming has elected a female U.S. House member in each of the last 10 elections to its at-large seat, and 10 of 13 contests overall since 1989, or 76.9 percent of the time.
Republican Barbara Cubin won the seat in 1994, 1996, 1998, 2000, 2002, 2004, and 2006 with Cynthia Lummis doing so in 2008, 2010, and 2012.
Wyoming’s rate of electing women to the U.S. House is more than 30 percentage points higher than any other state in the nation, and is the only state that has elected women into the chamber at an equal or larger rate based on the gender population of its residents (48.9 percent as of the 2010 Census).
If this report card were not graded on a curve, only one other state would get an ‘A’ rating over the last quarter-century: South Dakota, which has elected women to its at-large seat in six consecutive contests and six of 13 races during this span (46.2 percent).
However, grading the track record of states relative to one another yields three more “A” ratings: Hawaii (42.9 percent, 12 of 28 seats), Connecticut (37.9 percent, 25 of 66 seats), and Nevada (37.5 percent, 12 of 32 seats) – all electing female candidates in at least three in eight races to the chamber across these 25 years.
Both of Hawaii’s U.S. House seats are currently filled by women (Democrats Colleen Hanabusa and Tulsi Gabbard), with two of the five seats in Connecticut (Democrats Rosa DeLauro and Elizabeth Esty) and one of four seats in Nevada (Democrat Dina Titus).
California, which is responsible for the election of nearly one-quarter of all seats won by women during this 25-year period (179 of 736 seats, or 24.3 percent), earns an A- grade overall.
The Golden State has elected women at a 28.0 percent rate (179 of 640 contests) – good for #6 in the nation – including more than a third during the 2012 election (18 of 53 seats).
Missouri ranks #7 coming in at 21.1 percent (23 of 109 contests), followed by Maine at 20.8 percent (5 of 24), Colorado (16 of 78) and New York (76 of 371) at 20.5 percent, and Florida at 20.0 percent (58 of 290).
Florida, at #11, is the top-ranked southern state with none from that region cracking the Top 10. West Virginia is next at #12 with 18.9 percent.
Overall, the 16-state Southern region has elected women at the lowest rate in the nation at just 9.1 percent (169 of 1,855 races).
With eight states ranked in the Top 15 (Wyoming, Hawaii, Nevada, California, Colorado, New Mexico, Washington, Oregon) the Western region has elected women at a much higher rate than the rest of the country over the last 25 years.
Overall, female candidates from the 13-state region have won 279 of the 1,172 general and special U.S. House elections conducted since 1989, or 23.8 percent of the time.
That is nearly twice the rate of any other region in the country with the 12-state Midwestern region (156 of 1,249 contests) and nine-state Northeastern region (131 of 1,049) both coming in at 12.5 percent.
The national rate of female U.S. Representatives winning seats during this span is 13.8 percent (735 of 5,325).
However, states from all four regions of the country populate the Bottom 10 slots on the list – none of which elected any women to the U.S. House over the last 25 years: Alaska, Delaware, Iowa, Louisiana, Mississippi, Montana, Nebraska, North Dakota, Rhode Island, and Vermont.
Six of these states have never done so – some 97+ years after the first woman was elected to the House in 1916: Alaska, Delaware, Iowa, Mississippi, North Dakota, and Vermont.
Three other states receive failing grades – electing women to the House in less than 1 out of 25 contests over the last quarter-century: South Carolina (1.3 percent), Oklahoma (2.9 percent), and New Jersey (3.8 percent).
Twelve additional states have elected women to the chamber at a rate of less than 1 in 10, receiving below average grades ranging from D- (Massachusetts, Pennsylvania, Arkansas, Alabama, Georgia), to D (Virginia, Utah), D+ (Kentucky), to C- (Arizona, Texas, Tennessee, and Indiana).
Percentage of U.S. House Seats Won by Women by State, 1989-2014
|
Rank
|
State
|
Grade
|
# Won
|
# Contests
|
% Won
|
|
1
|
Wyoming
|
A+
|
10
|
13
|
76.9
|
|
2
|
South Dakota
|
A
|
6
|
13
|
46.2
|
|
3
|
Hawaii
|
A
|
12
|
28
|
42.9
|
|
4
|
Connecticut
|
A
|
25
|
66
|
37.9
|
|
5
|
Nevada
|
A
|
12
|
32
|
37.5
|
|
6
|
California
|
A-
|
179
|
640
|
28.0
|
|
7
|
Missouri
|
B+
|
23
|
109
|
21.1
|
|
8
|
Maine
|
B+
|
5
|
24
|
20.8
|
|
9
|
Colorado
|
B+
|
16
|
78
|
20.5
|
|
9
|
New York
|
B+
|
76
|
371
|
20.5
|
|
11
|
Florida
|
B+
|
58
|
290
|
20.0
|
|
12
|
West Virginia
|
B
|
7
|
37
|
18.9
|
|
13
|
New Mexico
|
B
|
7
|
38
|
18.4
|
|
14
|
Washington
|
B
|
20
|
109
|
18.3
|
|
15
|
Oregon
|
B-
|
11
|
62
|
17.7
|
|
16
|
Ohio
|
B-
|
39
|
226
|
17.3
|
|
17
|
New Hampshire
|
B-
|
4
|
24
|
16.7
|
|
18
|
North Carolina
|
C+
|
22
|
151
|
14.6
|
|
19
|
Kansas
|
C+
|
7
|
49
|
14.3
|
|
20
|
Maryland
|
C+
|
13
|
98
|
13.3
|
|
21
|
Idaho
|
C+
|
3
|
24
|
12.5
|
|
22
|
Wisconsin
|
C
|
12
|
103
|
11.7
|
|
23
|
Michigan
|
C
|
22
|
189
|
11.6
|
|
24
|
Minnesota
|
C
|
11
|
96
|
11.5
|
|
25
|
Illinois
|
C
|
25
|
239
|
10.5
|
|
26
|
Indiana
|
C-
|
11
|
117
|
9.4
|
|
27
|
Tennessee
|
C-
|
10
|
108
|
9.3
|
|
28
|
Texas
|
C-
|
31
|
379
|
8.2
|
|
29
|
Arizona
|
C-
|
7
|
86
|
8.1
|
|
30
|
Kentucky
|
D+
|
5
|
76
|
6.6
|
|
31
|
Utah
|
D
|
2
|
37
|
5.4
|
|
32
|
Virginia
|
D
|
7
|
134
|
5.2
|
|
33
|
Georgia
|
D-
|
7
|
147
|
4.8
|
|
34
|
Alabama
|
D-
|
4
|
86
|
4.7
|
|
35
|
Arkansas
|
D-
|
2
|
49
|
4.1
|
|
35
|
Pennsylvania
|
D-
|
10
|
245
|
4.1
|
|
37
|
Massachusetts
|
D-
|
5
|
124
|
4.0
|
|
38
|
New Jersey
|
F
|
6
|
159
|
3.8
|
|
39
|
Oklahoma
|
F
|
2
|
68
|
2.9
|
|
40
|
South Carolina
|
F
|
1
|
75
|
1.3
|
|
41
|
Alaska
|
F
|
0
|
12
|
0.0
|
|
41
|
Delaware
|
F
|
0
|
12
|
0.0
|
|
41
|
North Dakota
|
F
|
0
|
12
|
0.0
|
|
41
|
Vermont
|
F
|
0
|
12
|
0.0
|
|
41
|
Montana
|
F
|
0
|
13
|
0.0
|
|
41
|
Rhode Island
|
F
|
0
|
24
|
0.0
|
|
41
|
Nebraska
|
F
|
0
|
36
|
0.0
|
|
41
|
Mississippi
|
F
|
0
|
57
|
0.0
|
|
41
|
Iowa
|
F
|
0
|
60
|
0.0
|
|
41
|
Louisiana
|
F
|
0
|
88
|
0.0
|
|
|
Total
|
|
735
|
5,325
|
13.8
|
Includes general and special elections through March 2014. Table compiled by Smart Politics.
Follow Smart Politics on Twitter.