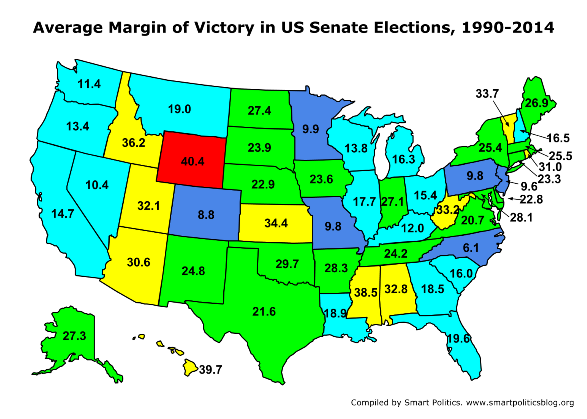
Which States Host the Most Competitive US Senate Races?
North Carolina has hosted the most competitive races for the U.S. Senate over the last quarter-century with Colorado, New Jersey, Missouri, Pennsylvania, and Minnesota close behind
 Democrats face an uphill battle to take back the U.S. Senate in 2016 and, unlike the GOP in 2014, they will not have the advantage of multiple open seat opportunities to reach their goal with only Florida and Indiana opening up thus far.
The party expects to be competitive in Florida along with states like Illinois, New Hampshire, Pennsylvania, and Wisconsin with leaders trying to coax former U.S. Senator Kay Hagan to challenge two-term GOP incumbent Richard Burr next year in North Carolina to add to that list.
Hagan is being characterized as the best – and only – hope for the party in 2016 to win the seat.
Hagan lost her seat last November to Thom Tillis by 1.6 points – the second closest race in the nation in 2014 behind Mark Warner’s 0.8-point win over Ed Gillespie in Virginia.
If Democrats are to believed that Hagan is their first, second, and third choice, a 2016 race without the former U.S. Senator means North Carolina will likely face its biggest blow-out race for the chamber in more than 40 years.
Moreover, it would put the brakes on a long string of competitive races the likes of which no other state has seen over the last quarter-century.
Smart Politics examined the 450+ U.S. Senate elections conducted since 1990 and found that North Carolina has hosted the most competitive races to the chamber with an average victory margin of 6.1 points and the largest number of contests decided by single-digits (eight of nine elections).
Since 1990, there have been 457 general and special elections to the U.S. Senate with each state holding between eight and 11 such contests.
North Carolina leads the nation with an average margin of victory of just 6.1 points across its nine elections to the chamber during this span.
While last year’s Tillis vs. Hagan matchup was the closest in the state during this period, North Carolina U.S. Senate races have consistently offered match-ups between fairly evenly matched opponents:
● 1990: Republican Jesse Helms won a fourth term by 5.2 points over former Charlotte Mayor Harvey Gantt
● 1992: Republican Lauch Faircloth unseated two-term Democrat Terry Sanford by 4.0 points.
● 1996: Helms won his fifth and final term by 6.7 points in a rematch against Gantt
● 1998: Democrat John Edwards ousted Faircloth with a 4.1-point victory
● 2002: Republican Elizabeth Dole won an open seat race by 8.6 points against former Bill Clinton Chief of Staff Erskine Bowles
● 2004: Bowles ran in back-to-back cycles but lost again in an open seat race, this time to U.S. Representative Richard Burr by 4.6 points
● 2008: Democratic State Senator Kay Hagen unseated Dole by 8.5 points
● 2010: Burr won his second term with an 11.8-point win over North Carolina Secretary of State Elaine Marshall
● 2014: State Representative Thom Tillis unseated Hagan with a 1.6-point victory
The Tar Heel State’s proclivity to produce competitive races actually extends well before 1990 with 13 of its 14 U.S. Senate elections decided by single-digits since 1978.
The last truly uncompetitive U.S. Senate race in North Carolina took place more than 40 years ago in 1974 when Democratic State Attorney General Robert Morgan won an open seat race against furniture executive Bill Stevens by 25.1 points.
Following North Carolina are five other states which have hosted U.S. Senate races with an average victory margin of less than 10 points over the last quarter-century.
Colorado boasts the second lowest mark in the nation at 8.8 points, followed by New Jersey at 9.6 points, Missouri and Pennsylvania tied for fourth at 9.8 points, and Minnesota at 9.9 points.
The most notable close elections in these states during the last 25 years are:
● Colorado, 2010 (1.7 points): Democrat Michael Bennet defeating Ken Buck
● New Jersey, 1990 & 2000 (3.0 points): Democrat Bill Bradley over Christine Todd Whitman and Democrat Jon Corzine beating Bob Franks respectively
● Missouri, 2002 (1.1 points): Republican Jim Talent defeating Senator Jean Carnahan
● Pennsylvania, 2010 (2.0 points): Republican Pat Toomey over Joe Sestak
● Minnesota, 2008 (0.0 points): DFLer Al Franken beating Senator Norm Coleman
Rounding out the Top 10 states are Nevada with an average victory margin of 10.4 points, Washington at 11.4 points, Kentucky at 12.0 points, and Oregon at 13.4 points.
Most of these Top 10 states will hold elections to the U.S. Senate in 2016 (all except Minnesota and New Jersey) with particularly competitive races expected in Colorado, Nevada, and Pennsylvania.
Although they have been quintessential battleground states in presidential elections in recent cycles, Florida (19.6 points), Iowa (23.6 points), and New Mexico (24.8 points) have been average at best in serving up competitive U.S. Senate races.
Wyoming, meanwhile, has crowned its U.S. Senators by the widest of margins with its 10 contests since 1990 decided by an average of 40.4 points.
The margin of victory has dipped below the 25-point mark just twice in the Equality State during this period: Craig Thomas’s 19.6-point win over Mike Sullivan in 1994 and Mike Enzi’s 11.9-point win over Kathy Karpan in 1996.
Hawaii is next at 39.7 points, then Mississippi at 38.5 points, Idaho at 36.2 points, Kansas at 34.4 points, Vermont at 33.7 points, West Virginia at 33.2 points, Alabama at 32.8 points, Utah at 32.1 points, and Rhode Island at 31.0 points.
The average victory margin for the 457 U.S. Senate contests conducted across all 50 states since 1990 is 22.6 points.
A total of 129 of these 457 races were decided by single-digits, or 28.2 percent.
North Carolina also leads the way by this measure with victory margins of less than 10 points in eight of its nine races (89 percent).
Colorado, Georgia, and Virginia are next at 67 percent followed by Georgia at 60 percent, Missouri, New Hampshire, and Pennsylvania at 56 percent, and Nevada, New Jersey, Oregon, and Wisconsin at 50 percent.
Alaska owns the current mark of four consecutive U.S. Senate races with a victory margin of less than 10 points.
During this 25-year span, nine states have failed to host even one U.S. Senate race that was decided by single-digits: Delaware, Idaho, Kansas, Maryland, Oklahoma, Texas, Utah, West Virginia, and Wyoming.
The state with the longest competitive U.S. Senate race drought is Maryland, which last saw a race for the nation’s upper legislative chamber decided by single digits 45 years ago in 1970 when GOPer John Beall defeated incumbent Joseph Tydings by 2.6 points.
Competitive U.S. Senate Races By State Since 1990
|
Rank
|
State
|
# Elections
|
< 10 pts
|
% < 10 pts
|
Ave MoV
|
|
1
|
North Carolina
|
9
|
8
|
88.9
|
6.1
|
|
2
|
Colorado
|
9
|
6
|
66.7
|
8.8
|
|
3
|
New Jersey
|
10
|
5
|
50.0
|
9.6
|
|
4
|
Missouri
|
9
|
5
|
55.6
|
9.8
|
|
4
|
Pennsylvania
|
9
|
5
|
55.6
|
9.8
|
|
6
|
Minnesota
|
9
|
6
|
66.7
|
9.9
|
|
7
|
Nevada
|
8
|
4
|
50.0
|
10.4
|
|
8
|
Washington
|
8
|
3
|
37.5
|
11.4
|
|
9
|
Kentucky
|
9
|
4
|
44.4
|
12.0
|
|
10
|
Oregon
|
10
|
5
|
50.0
|
13.4
|
|
11
|
Wisconsin
|
8
|
4
|
50.0
|
13.8
|
|
12
|
California
|
9
|
2
|
22.2
|
14.7
|
|
13
|
Ohio
|
8
|
2
|
25.0
|
15.4
|
|
14
|
South Carolina
|
10
|
4
|
40.0
|
16.0
|
|
15
|
Michigan
|
9
|
2
|
22.2
|
16.3
|
|
16
|
New Hampshire
|
9
|
5
|
55.6
|
16.5
|
|
17
|
Illinois
|
10
|
3
|
30.0
|
17.7
|
|
18
|
Georgia
|
10
|
6
|
60.0
|
18.5
|
|
19
|
Louisiana
|
9
|
3
|
33.3
|
18.9
|
|
20
|
Montana
|
9
|
4
|
44.4
|
19.0
|
|
21
|
Florida
|
8
|
2
|
25.0
|
19.6
|
|
22
|
Virginia
|
9
|
6
|
66.7
|
20.7
|
|
23
|
Texas
|
10
|
0
|
0.0
|
21.6
|
|
24
|
Delaware
|
10
|
0
|
0.0
|
22.8
|
|
25
|
Nebraska
|
9
|
2
|
22.2
|
22.9
|
|
26
|
Connecticut
|
8
|
1
|
12.5
|
23.3
|
|
27
|
Iowa
|
9
|
3
|
33.3
|
23.6
|
|
28
|
South Dakota
|
9
|
4
|
44.4
|
23.9
|
|
29
|
Tennessee
|
10
|
2
|
20.0
|
24.2
|
|
30
|
New Mexico
|
9
|
2
|
22.2
|
24.8
|
|
31
|
New York
|
9
|
1
|
11.1
|
25.4
|
|
32
|
Massachusetts
|
11
|
3
|
27.3
|
25.5
|
|
33
|
Maine
|
9
|
1
|
11.1
|
26.9
|
|
34
|
Indiana
|
9
|
2
|
22.2
|
27.1
|
|
35
|
Alaska
|
9
|
4
|
44.4
|
27.3
|
|
36
|
North Dakota
|
9
|
1
|
11.1
|
27.4
|
|
37
|
Maryland
|
8
|
0
|
0.0
|
28.1
|
|
38
|
Arkansas
|
9
|
2
|
22.2
|
28.3
|
|
39
|
Oklahoma
|
11
|
0
|
0.0
|
29.7
|
|
40
|
Arizona
|
8
|
2
|
25.0
|
30.6
|
|
41
|
Rhode Island
|
9
|
1
|
11.1
|
31.0
|
|
42
|
Utah
|
8
|
0
|
0.0
|
32.1
|
|
43
|
Alabama
|
9
|
1
|
11.1
|
32.8
|
|
44
|
West Virginia
|
10
|
0
|
0.0
|
33.2
|
|
45
|
Vermont
|
8
|
1
|
12.5
|
33.7
|
|
46
|
Kansas
|
10
|
0
|
0.0
|
34.4
|
|
47
|
Idaho
|
9
|
0
|
0.0
|
36.2
|
|
48
|
Mississippi
|
10
|
1
|
10.0
|
38.5
|
|
49
|
Hawaii
|
10
|
1
|
10.0
|
39.7
|
|
50
|
Wyoming
|
10
|
0
|
0.0
|
40.4
|
Table compiled by Smart Politics.
Follow Smart Politics on Twitter.


1. “CO, GA, and VA are next at 67% followed by GA at 60%…” The Peach State surely can not have both percentages – or can it?
2. For the current ’19-’20 cycle, the Tar Heel State seems poised to produce another hotly competitive Senate election. It may even host a fiercely contested, if not ultimately competitive, R primary race, perhaps one between first-term Senator Thom Tillis and Representative Mark Walker.