
Chick-fil-A By The Numbers Revisited
The number of Chick-fil-A restaurants in blue states has more than doubled since 2012
 Over the last two decades, few restaurants have attracted as much attention for political reasons as Chick-fil-A.
The popular franchise – known in part for being closed on Sundays due to the strong religious beliefs of its founder – has been sporadically embroiled in its fair share of controversy, particularly when it comes to LGBTQ issues.
Back in the thick of it in 2012, Chick-fil-A stated the company did not want to be part of the policy debate on these issues – although criticisms of the company continued to resurface, such as claims that it backed charities with purported anti-LGBTQ practices thereafter.
Almost a decade ago, Smart Politics highlighted the nation’s blue and red divide as seen through this restaurant chain – noting how the Southern-based company had nearly three times the rate of stores per resident in states carried by John McCain in 2008 compared to states carried by Barack Obama.
Nearly a decade later, the company seems to be as popular as ever. But has it made inroads in blue states?
For starters, the number of franchises across the country has surged from 2012 to 2021 – increasing 60.5 percent from 1,712 restaurants in the United States to 2,748 according to data culled by Smart Politics from the company’s website.
The number of restaurants located in “blue states” (the 20 states plus Washington, D.C. which continuously voted for Democratic presidential nominees from 2008 through 2020) has increased by 122 percent – from 314 locations in 2012 to 697 today.
Meanwhile, the number of restaurants located in “red states” (the 20 states which continuously voted for GOP presidential nominees from 2008 through 2020) increased by less than half that amount – 54 percent, from 710 locations to 1,089.
[Note: There was an increase of 40 percent of locations across the 10 states that voted for Democratic and Republican nominees for president during the last four cycles – from 688 to 962].
In 2012, McCain/Romney/Trump states had 8.9 Chick-fil-A restaurants per million residents, compared to 2.3 locations per million residents for Obama/Clinton/Biden states.
Today, McCain/Romney/Trump states have 12.5 restaurants per million residents with Obama/Clinton/Biden states at 4.8.
In short, the Chick-fil-A gap dropped from 3.8 times as many restaurants in red states to blue states per capita to 2.6 times as many.
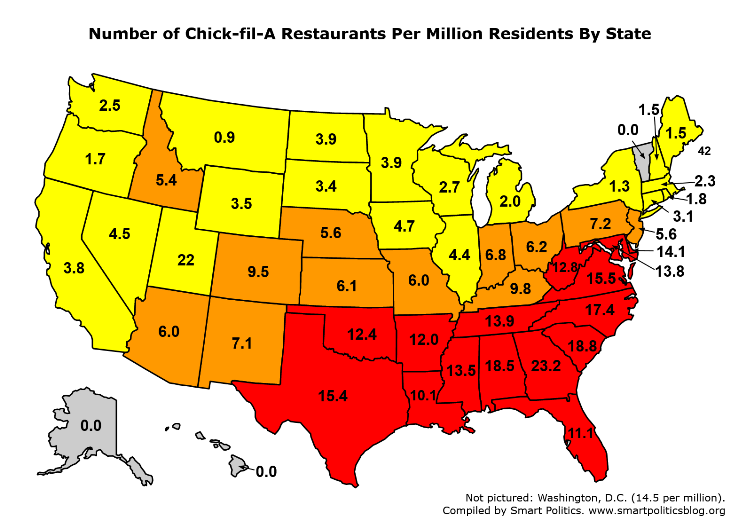
Georgia – home to the company’s headquarters in Atlanta – leads the nation with 23.2 stores per million residents (248 locations across the state).
Southern states dominate the Top 10 rankings with South Carolina next at 18.8 per million residents followed by Alabama (18.5), North Carolina (17.4), Virginia (15.5), Texas (15.4), Washington, D.C. (14.5), Delaware (14.1), Tennessee (13.9), and Maryland (13.8).
D.C. experienced the biggest jump (0.0 to 14.5 per million) as the District did not see its first Chick-fil-A restaurant open until November 2015.
Delaware saw an increase of 7.5 restaurants per million residents with Mississippi (+4.7), Alabama (4.7), Texas (4.6), Nevada (4.5), New Mexico (4.2), and Utah (4.0) experiencing the next greatest per capita increase.
During the Summer of 2012, there were 11 states plus the District of Columbia that did not have a single Chick-Fil-A restaurant. Seven were blue states (Connecticut, Hawaii, Maine, Nevada, Oregon, Rhode Island, Vermont) and four were red states (Alaska, Montana, North Dakota, South Dakota).
Since then, eight of these states plus D.C. have opened at least one Chick-Fil-A – all but Alaska, Hawaii, and Vermont.
Follow Smart Politics on Twitter.