
Minnesota to Retire Most Competitive Congressional Map Since DFL Merger
Forty percent of Minnesota U.S. House races since 2012 were decided by single digits
 While Minnesota and neighboring Wisconsin each have eight congressional districts, the disparity in drama across the U.S. House elections each state has hosted for the last decade has been pronounced.
In Wisconsin, no seats flipped from the 41 elections held under the current congressional map first implemented for the 2012 cycle.
In Minnesota, six seats flipped during this span (the 8th CD in 2012 and 2018, the 1st, 2nd, and 3rd CDs in 2018, and the 7th CD in 2020).
As documented earlier in the week by Smart Politics, Wisconsin is about to retire a congressional district map that produced the lowest rate of competitive races in state history – with just one out of 41 U.S. House elections decided by single digits since 2012.
Meanwhile, in Minnesota, the victory margin was less than 10 points in 16 of the 40 elections held over the last five cycles (40 percent) – including nine by less than five points and three by less than one point.
As a result, while Wisconsin’s U.S. House races were decided by an average of 30.7 points over the last decade, the average victory margin in Minnesota was just 18.2 points.
Looking back across the last few generations, U.S. House elections over the last four maps since 1982 have been decidedly closer in Minnesota (24.6 points on average) than in Wisconsin (36.1 points).
With 40 percent of all races decided by single digits since 2012, the current congressional map in Minnesota produced a higher rate of competitive races than any map drawn since the merger of the Democrats and Farmer-Laborites in 1944.
The only other map that produced a larger percentage of competitive races since the turn of the 20th Century was the 1933-1941 map – 15 of 36 elections (41.7 percent) – as the GOP, Farmer-Laborites, and Democrats battled it out winning 23, 10, and three seats respectively. [Maps were not drawn in time for the 1932 cycle at which point all nine seats were elected at-large].
The heightened competition coming from the current Minnesota congressional map comes on the heels of the 2002-2011 map during which only seven of 40 races were decided by single digits (17.5 percent) – the second lowest rate in state history.
The 1972-1981 map produced the fewest competitive races – just five of 41 (12.2 percent).
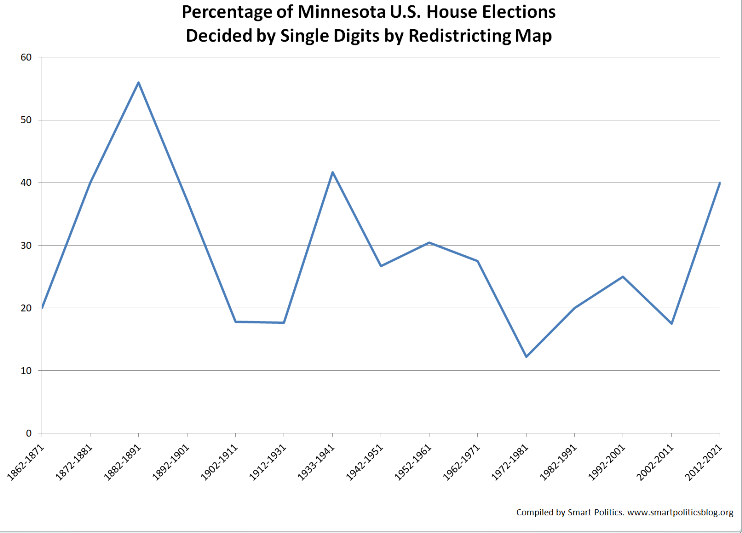
Excluding at-large races (pre-1862, one contest in 1912, and the 1932 cycle), 159 of Minnesota’s 600 U.S. House elections have had single-digit victory margins (26.5 percent) with a peak of 56 percent (14 of 25) from the 1882-1891 map.
Partisan control of the state’s five congressional districts flipped an astounding 10 times across the 25 elections held during the 1882 through 1890 cycles.
Follow Smart Politics on Twitter.